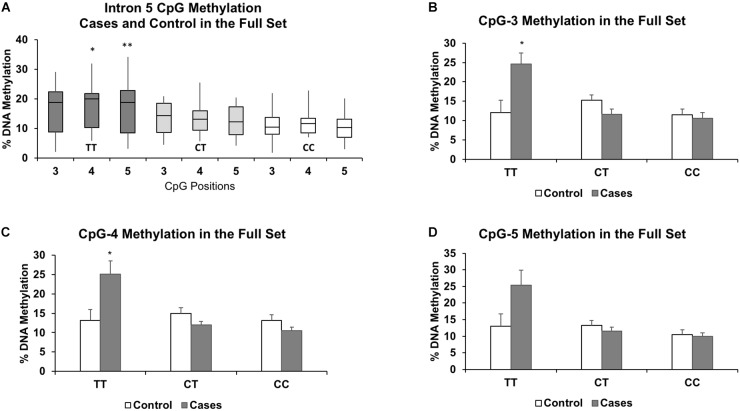
FIGURE 3.
Results of the full set show similar associations between increased methylation and the TT genotype for CpGs 3-5 (A). The results also highlight the similarities in DNA methylation levels between the heterozygous (CT) and protective homozygous (CC) genotypes. Methylation levels for each genotype further segregated by case status for CpG-3 (B), CpG-4 (C), and CpG-5 (D) show a pronounced increase in methylation in the TT genotype in the cases compared to controls. The bar graphs are represented as mean ± SEM. For both the boxplots and the bar graphs, ∗ and ∗∗ indicates P-values < 0.05 and < 0.01, respectively, in mean methylation difference between TT and CT+CC genotypes for each CpG.

