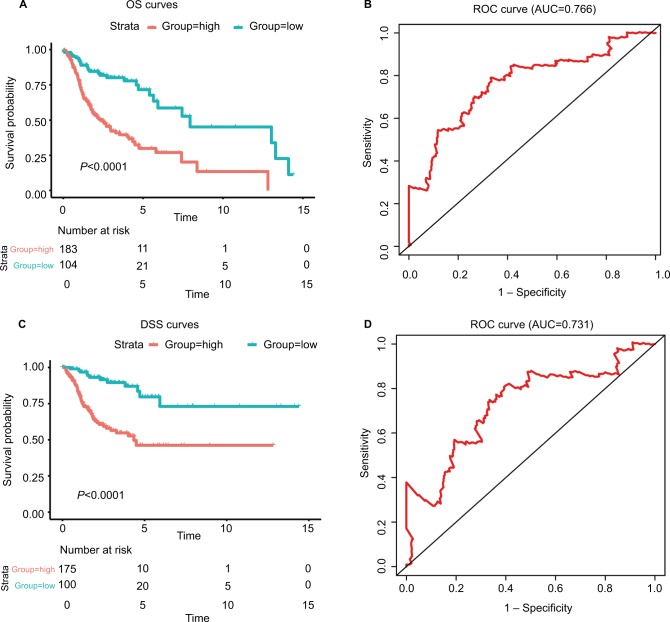
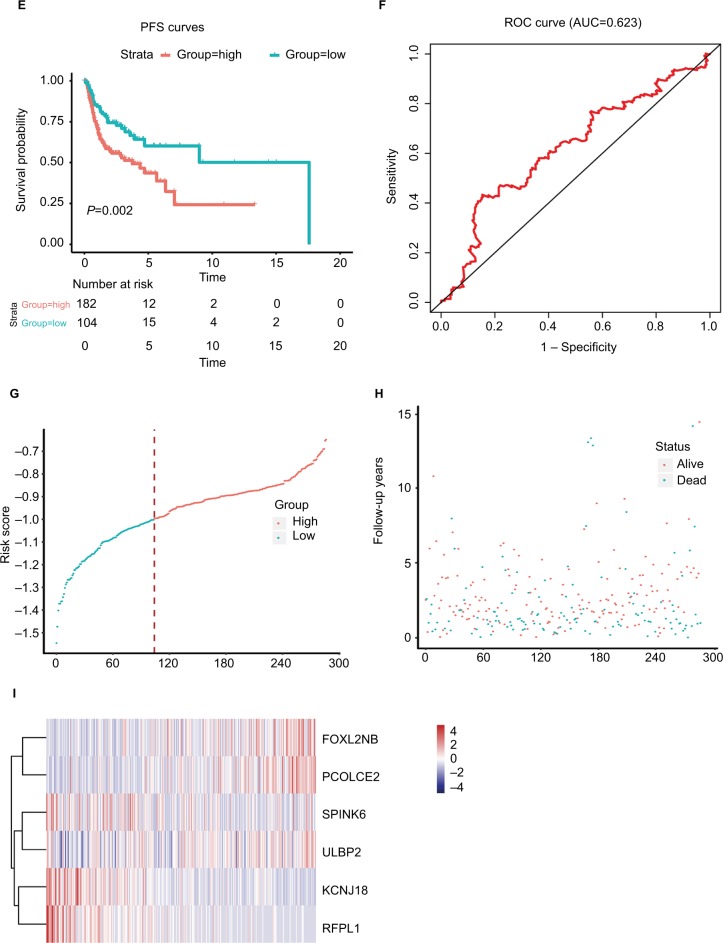
Figure 3.
The risk score performance in the training data sets.
Notes: (A-F) The survival plot and the 5-year survival ROC curve of OS, DSS, and PFS. (G–I) The relationship between risk score, survival information, and z-score transformed expression values are shown (top-down, FOXL2NB, PCOLCE2, SPINK6, ULBP2, KCNJ18, and RFPL1).
Abbreviations: AUC, area under the curve; DSS, disease-specific survival; OS, overall survival; PFS, progression-free survival; ROC, receiving operating characteristic.


