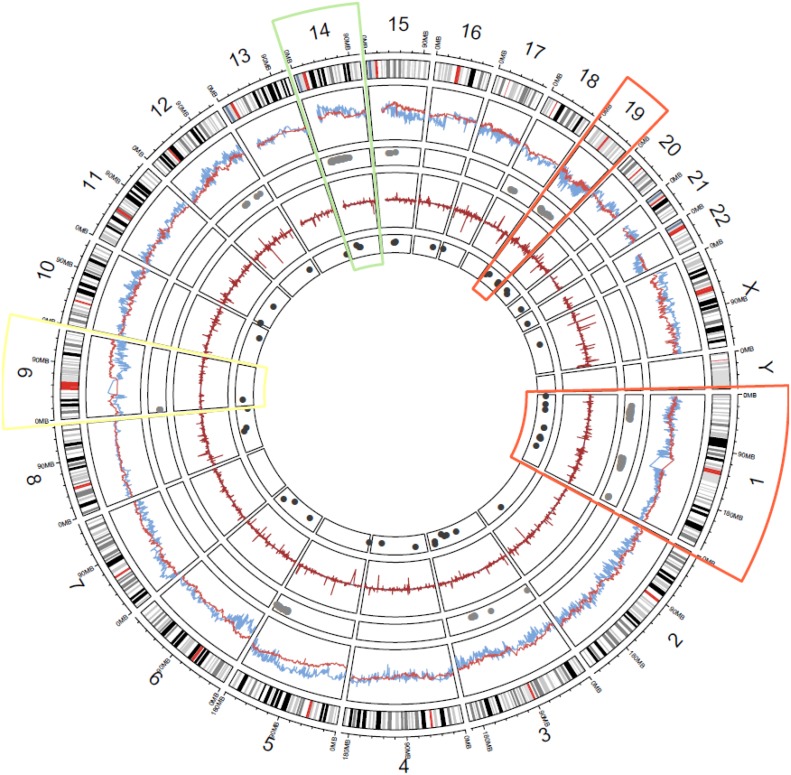
Figure 1. Genome-wide landscape of NM-associated CNV and mRNA: Layers, starting from outermost are (1) chromosome number and mega base scale; (2) ideogram of each chromosome (centromeres in red); (3) genome-wide model coefficient estimates of odds of NM for each gene (METABRIC = blue, TCGA = red); (4) replicated CNV genes associated with NM (grey dots); (5) genome-wide log-fold change between case and control mRNA (METABRIC = blue, TCGA = red); (6) replicated mRNA genes associated with NM (dark grey dots).
Highlighted chromosomes bring attention to omic regions of interest (ROIs): orange = consistent CNV/RNA losses in ROIs (chromosomes 1 & 19), white = inconsistent CNV/mRNA measures in replicated ROIs (chromosome 9), green = consistent CNV/mRNA gains in replicated ROIs (chromosome 14).

