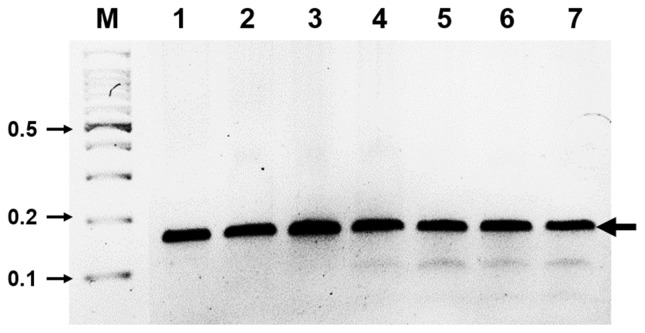
Fig. 2.
Determination of optimal reaction time for ASGV diagnosis using RT-RPA. ASGV was amplified with RT-RPA for different time points and a clear DNA band of the expected size (143 bp) could be visualized by agarose gel electrophoresis. M, DNA marker; lanes 1–7, DNA products from reactions incubated for 1, 3, 5, 10, 15, 20, and 30 min, respectively.

