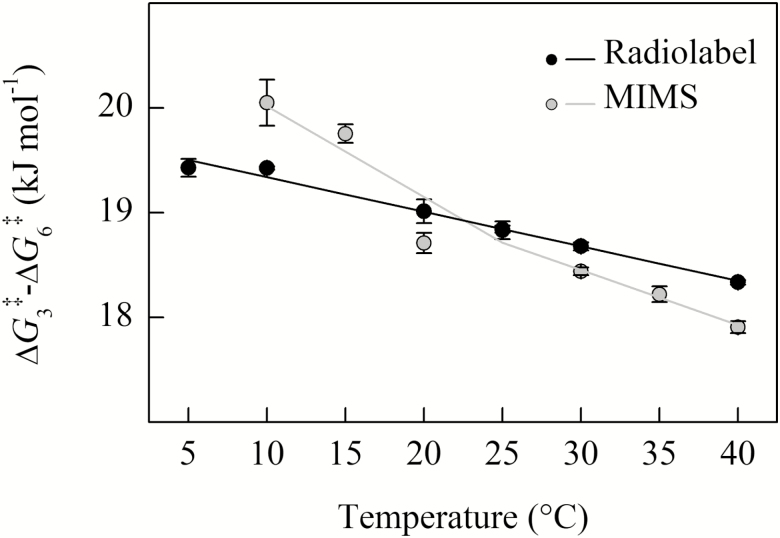
Fig. 5.
The temperature response of ΔG3‡–ΔG6‡ calculated from the data presented in Fig. 4. Both measurement methods show a decrease with temperature. Solid black circles are the mean of four replicates measured using radiolabel, filled gray circles are the means from three replicates using MIMS; the SE is shown. The solid lines indicate the linear regression fit to calculated values.

