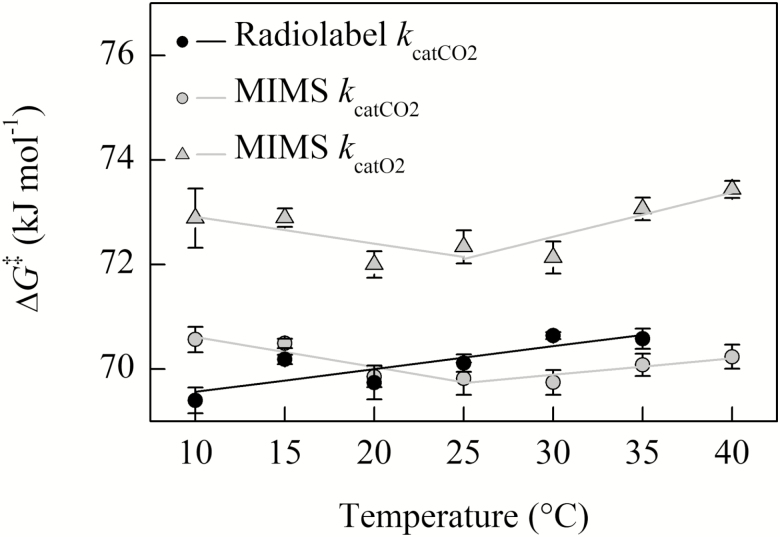
Fig. 6.
The temperature response of ΔGkcatCO2‡ for MIMS and radiolabel methods, and ΔGkcatO2‡ for MIMS calculated from the data presented in Fig. 2. Two regressions were fit to the MIMS data on either side of the 25 °C breakpoint; a single regression is fit to the radiolabel data. Solid black circles are the mean of three replicates measured using radiolabel, filled gray circles are the means from three replicates using MIMS; the SE is shown.

