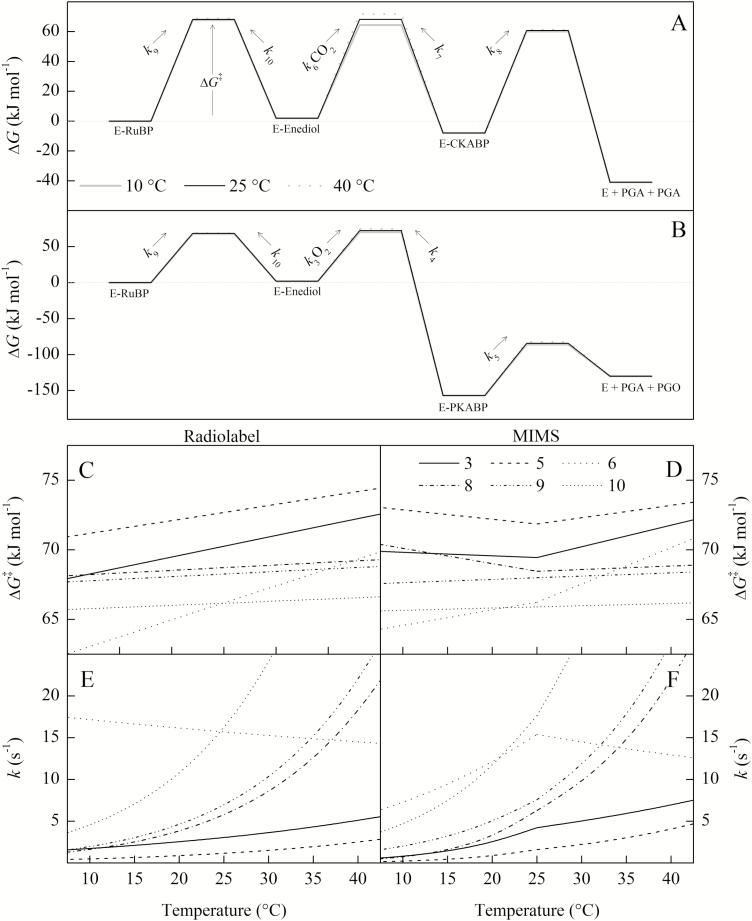
Fig. 7.
A kinetic energy barrier diagram showing the modeled temperature responses of the energy barrier to the transition state (ΔG‡) and the corresponding first-order rate constant k. The ΔG‡ and k are indicated by the numbered step of the reaction following Fig. 1. The assumptions made for this model are stated in the Materials and methods. For steps 3 and 6 (O2 and CO2 addition, respectively), the rate constants were multiplied by ambient concentrations O2 (21 kPa) and CO2 (41 Pa) as a pseudo-first-order approximation for comparison with the other rate constants and to calculate their respective ΔG‡. For the bottom figure, the left-hand column is modeled on the radiolabel data and the right-hand column on the MIMS data so that comparisons between continuous and breakpoint temperature responses can be made. The values for intermediates were taken from Tcherkez (2013) for (A) and Tcherkez (2016) for (B) and assumed to remain constant with temperature.

