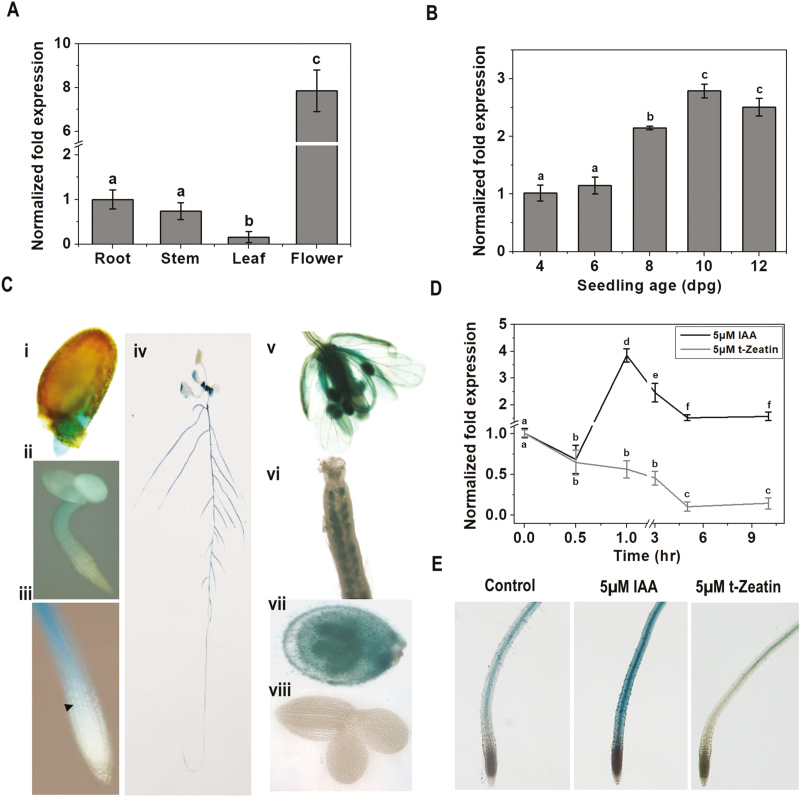
Fig. 4.
CIPK25 gene expression profiles in different tissues, root growth stages, and in response to hormone treatments. CIPK25 gene expression in different tissues (A) and in different root growth stages (B) analyzed by qRT-PCR. ACTIN2 expression was used for normalization. Error bars show ±SD, n=3. Different letters indicate significant differences among samples (ANOVA; P≤0.05). (C) CIPK25 promoter activities were investigated with promoter::reporter gene (GUS) constructs expressed in transgenic plants. Histochemical GUS stainings is shown for (i) the radicle of a germinating seedling; (ii) a 2 dpg seedling; (iii) the primary root tip of a 5 dpg seedling (the arrow indicates the first elongated cortex cell); (iv) a 10 dpg seedling; (v) flower; (vi) gynoecium; (vii) immature seeds with embryo; (viii) embryo. (D) Fold change in CIPK25 expression as analyzed by qRT-PCR in roots of 10 dpg Col-0 seedlings treated with 5 µM IAA and 5 µM t-zeatin for different time intervals. ACTIN2 expression was used for normalization. Error bars show ±SD, n=3. Different letters indicate significant differences among samples (ANOVA; P≤0.05). (E) pCIPK25::GUS expression was visualized in primary roots of 10 dpg seedlings treated with 5 µM IAA for 1 h and with 5 µM t-zeatin for 5 h.

