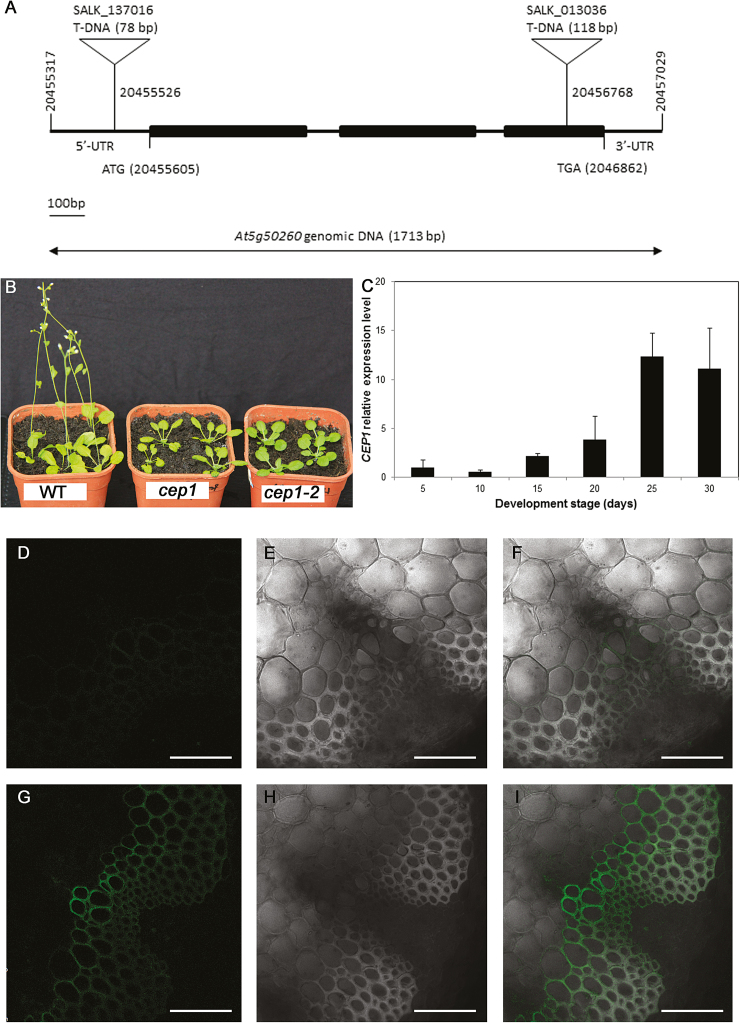
Fig. 1.
The phenotype of Arabidopsis cep1 mutant plants and CEP1 expression patterns. (A) Structure of the T-DNA insertion sites in cep1 and cep1-2. Exons are represented by the black bars. (B) Plants of the wild-type (WT), cep1, and cep1-2 at 4 weeks old. (C) CEP1 gene expression in the inflorescence stems of the wild-type at different time points after plant bolting (day 0). The relative expression level of CEP1 at each time point was compared to that of at 5 d after bolting. (D–I) Green fluorescent protein (GFP) signals were detected in the vascular tissues of ProCEP1-GFP transgenic Arabidopsis plants (G–I) but not in those of wild-type plants (D–F). (D, G) GFP channel, (E, H) bright channel, and (F, I) overlay of GFP and bright channels. Scale bars are 50 μm.

