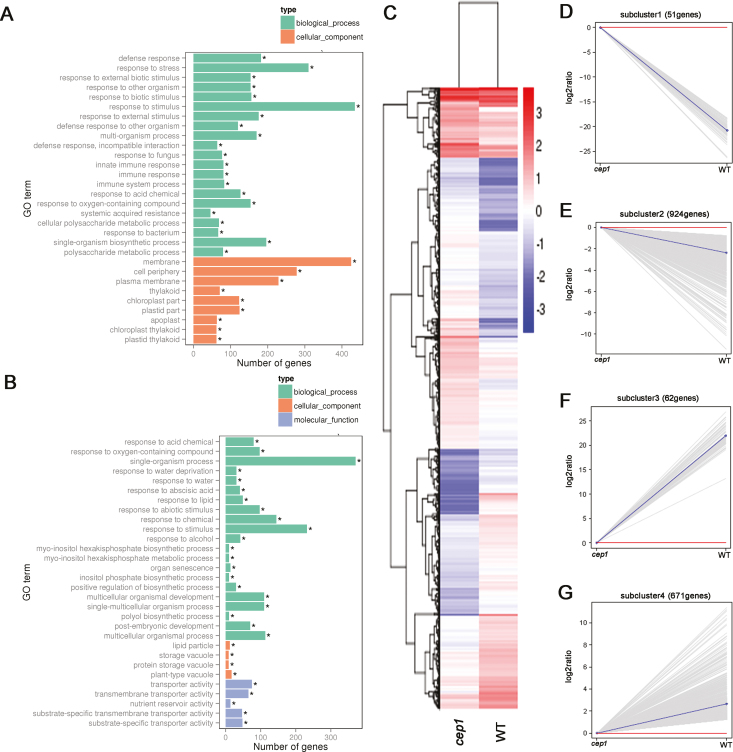
Fig. 6.
Transcriptome analyses of differentially expressed genes (DEGs). (A) Gene ontology (GO) terms of genes (A) up-regulated and (B) down-regulated in cep1 mutant plants relative to the wild-type (*P<0.05). (C) Hierarchical cluster analysis of DEGs (cep1 versus wild-type). Red indicates up-regulation and blue indicates down-regulation. Sub-clusters of down-regulated (D, E) and up-regulated (F, G) genes are shown. Each gray line indicates the relative expression ratio of one gene. Red lines indicate that the gene expression level in the cep1 mutant is equal to that of the wild-type (WT) (log2 ratio=0). Blue lines indicate the mean expression level of all genes in each sub-cluster.

