Fig. 1.
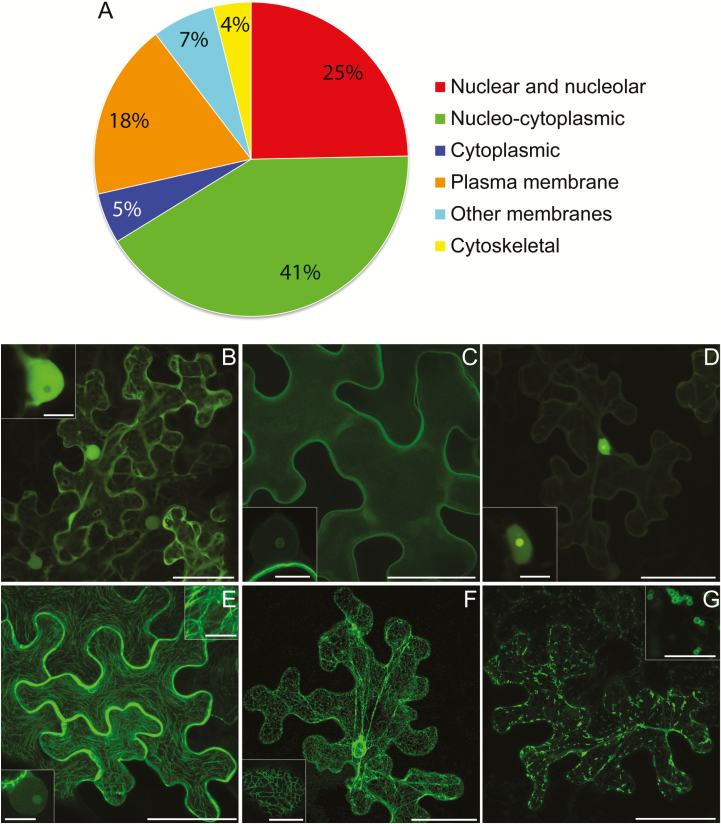
Summary and examples of localization patterns for transiently expressed effector fusions. A pie chart representation of the main localization patterns of GFP–effector fusions examined in this work combined with those previously published (A). The distinction between nucleo-cytoplasmic and cytoplasmic is that in the latter there was little or no fluorescence in the nucleus. The confocal projection images (B–D) show the most abundant patterns: nucleo-cytoplasmic (B), plasma membrane (C), and association with the nucleus (D). The insets show single optical sections through nuclei. Several of the plasma membrane-localized fusions had detectable fluorescence in the nucleolus (inset in C). All of the nuclear-associated fusions displayed some level of nucleolar labelling (inset in D). The images (E–G) represent some other patterns of localization observed for RXLR effector fusions. These were association with the microtubule cytoskeleton (E), two of which also labelled the nucleolus (lower inset in E), endoplasmic reticulum (F), and mitochondria (G; insets show higher magnification images). Scale bars are 50 μm for the main images and 10 μm for the insets.

