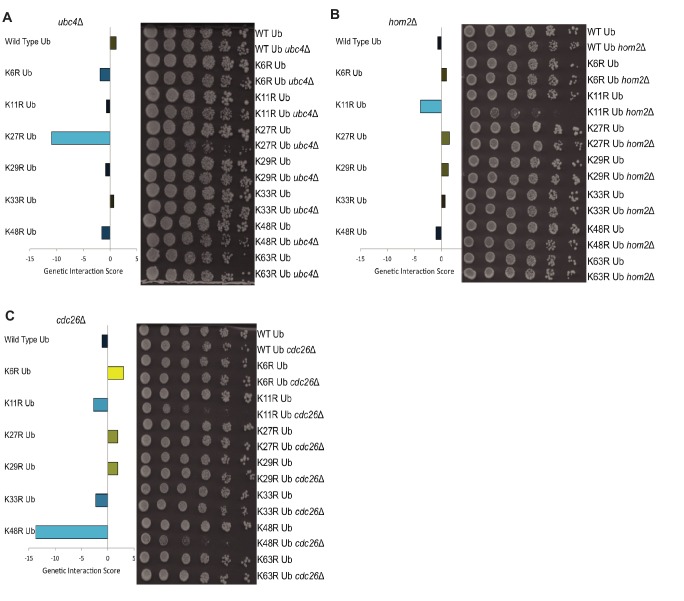
Figure 2. Gene deletions exhibit genetic interactions with specific ubiquitin linkage types.
(A–C) Left: The genetic interaction scores of K-to-R ubiquitin mutants with deletions of UBC4 (A), HOM2 (B), or CDC26 (C); Scores less than zero represent varying degrees of negative genetic interactions (blue bars), while scores larger than zero indicate positive interactions (yellow bars). Right: Candidate genetic interactions were validated by 5-fold spot dilution assays of the indicated strains.

