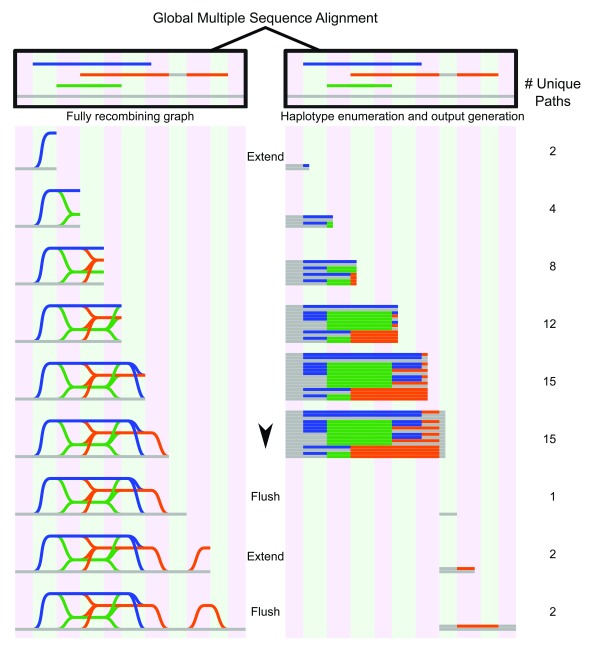
Figure 4. Graph genome generation with NovoGraph-Universal.
Graph representation (left) and unique variants (right) produced by graph genome alignment. From the global multiple sequence alignment, all unique paths through the graph genome are enumerated and written to output. In this example, the reference genome (gray) serves as a scaffold to which all contigs (blue, green, and orange) are aligned. In the first “extension” phase, all unique paths through the graph are identified until deviation from reference genome terminates. At this point, all variant paths are output, or “flushed” to the genome graph output; in this implementation, the variants are written to a VCF file. In the second extension phase, the orange contig deviates again from the reference genome, producing another variant, which, following coalescence back to the reference genome, is “flushed” to the output file.

