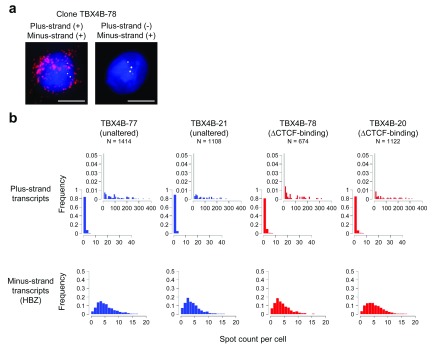
Figure 8. Kinetics of the plus- and minus-strand transcription in HTLV-1-infected T cell clones.
( a) Representative images of HTLV-1 transcripts by single-molecule RNA-FISH (maximum-projection of Z-stacks). Red spots indicate the plus-strand transcripts, and yellow spots the minus-strand transcripts. Blue indicates the DAPI-stained nucleus. Plus- and minus-signs in brackets indicate respectively the presence or absence of the mRNA. Scale bar (white) = 5 µm. ( b) Spot counts of the plus-strand (upper row) and the minus-strand transcripts (lower row) respectively in the unaltered and ΔCTCF-binding subclones. The insets in the upper row capture low-frequency events on a magnified y-axis. The bar in the first bin in the insets is greyed out because it is out of scale.

