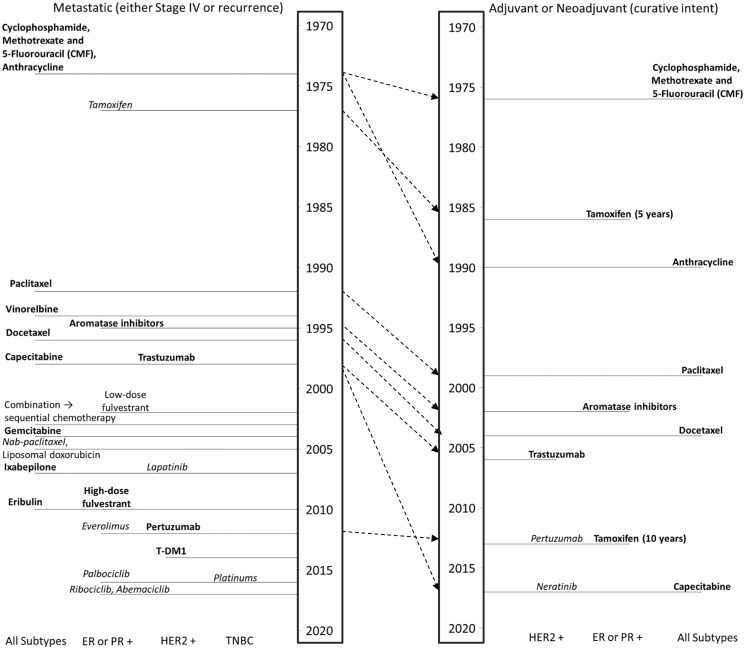
Figure 2.
Timeline diagram of breast cancer therapies. Bold font indicates that an overall survival benefit was reported in a randomized clinical trial or meta-analysis; italic font indicates that a progression-free survival (but no overall survival) benefit was reported in a randomized clinical trial or meta-analysis; and plain font indicates that no overall survival benefit nor progression-free survival benefit has been reported. Year of introduction is date of Food and Drug Administration (FDA) approval or, for drugs that are not FDA approved to treat breast cancer (vinorelbine, liposomal doxorubicin, platinums), the date of the first major publication that led to widespread use. Dashed arrows show the transition of each therapy from the metastatic setting, where nearly all were originally introduced, to the early-stage setting.

