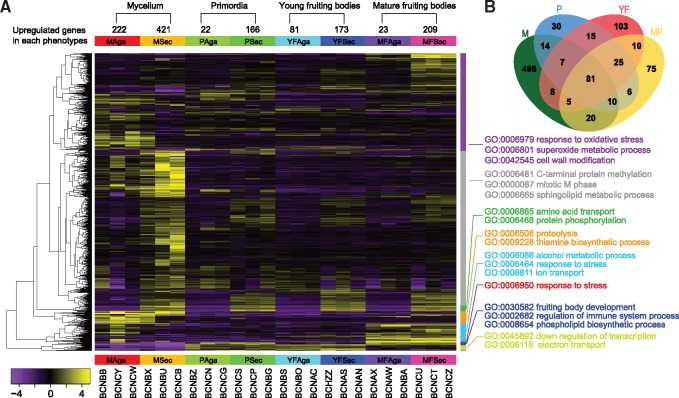
Fig. 7.
—Hierarchical clustering and functional classification of 907 genes that are differentially expressed between secotioid (Sec) and agaricoid (Aga) forms. (A) Hierarchical clustering of differentially expressed genes (fold change >4 and FDR < 0.05) in in mycelia (M), primordia (P), young fruiting bodies (YF), and mature fruiting bodies (MF). Enriched GO categories are shown by each cluster. Values of the color key refer to the log base 2 of fragments per kilobase of transcript per million mapped reads (FPKM). (B) Venn diagram of phenotype-related differential expressed genes in four stages.

