FIGURE 2.

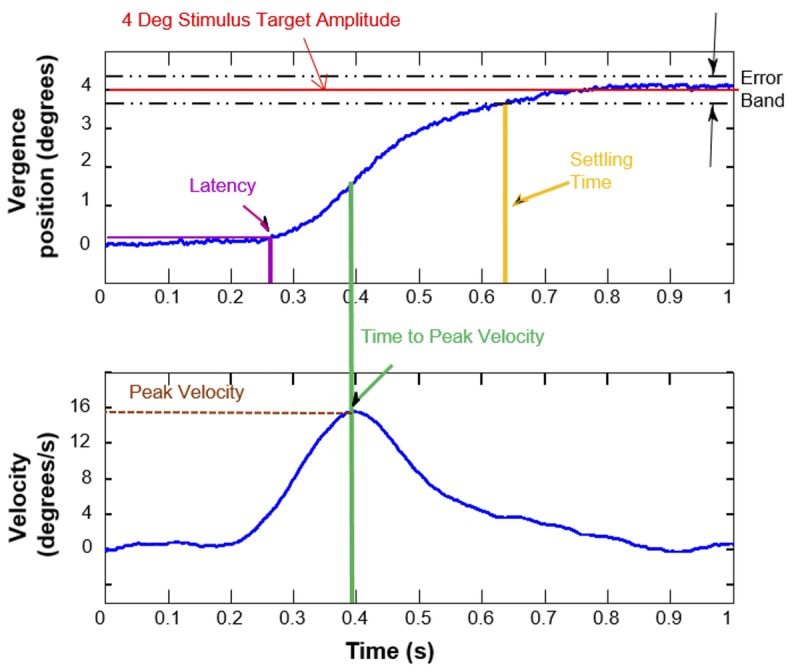
Data analysis of objective eye movements. The plot shows the temporal properties where the position is plotted as a function of time (upper plot) and the velocity is plotted as a function of time (lower plot).

Data analysis of objective eye movements. The plot shows the temporal properties where the position is plotted as a function of time (upper plot) and the velocity is plotted as a function of time (lower plot).