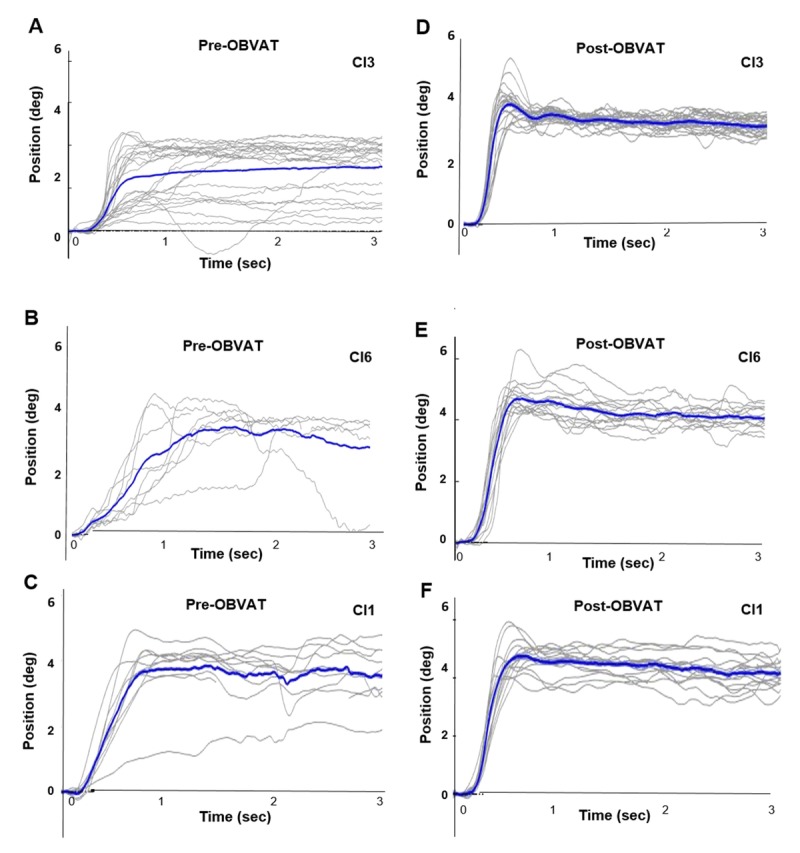
FIGURE 4.

Each gray line is an individual eye movement response from a 4° symmetrical binocular disparity vergence step stimulus. The blue traces show the average position before office-based vergence/accommodative therapy (OBVAT) for participants 3 (A), 6 (B), and 1 (C). (D, E, F) The same data after OBVAT for participants 3, 6, and 1.
