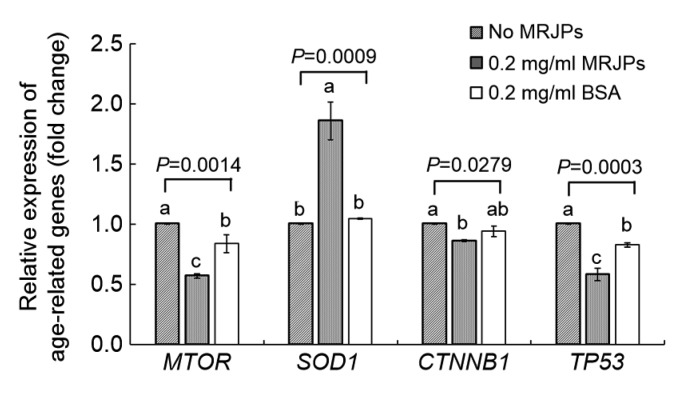
Fig. 6.
Age-related gene expression using qPCR
Data are shown as fold-changes of the negative control group (medium A). Data are expressed as mean±SD (n=3). Different lowercase letters (a–c) above bars within the same gene indicate a significant difference from each other at P<0.05 by Duncan’s multiple range test

