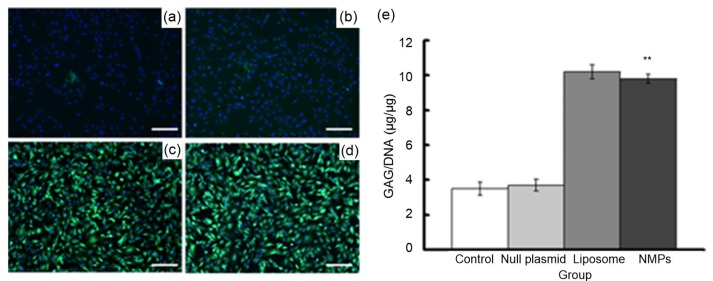
Fig. 5.
Expression of aggrecan after transfection
(a–d) Immunohistochemical staining results (×100, bar=25 μm): (a) control group; (b) null plasmid group; (c) liposome group; (d) NMPs group; green fluorescence represents extracellular matrix (ECM), blue fluorescence represents the cell nucleus. (e) Quantification of glycosaminoglycan (GAG) deposited in chondrocytes using GAG assay. Data are expressed as mean±SD (n=5). ** P<0.01 vs. the control group (Note: for interpretation of the references to color in this figure legend, the reader is referred to the web version of this article)

