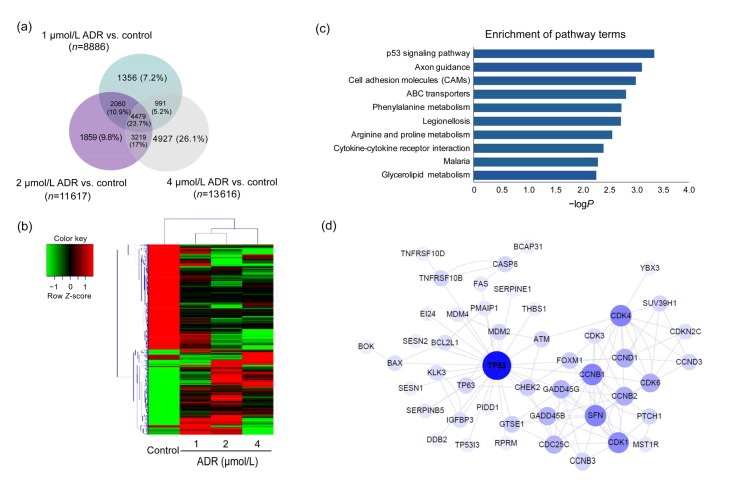
Fig. 3.
DEGs in the control group and ARPE-19 cells exposed to ADR
(a) Results of a Venn diagram analysis of the differentially expressed genes identified from the control and ADR-treated groups. (b) A heat map of hierarchical clustered genes. In total, 4479 genes from the genomics data showed a significantly aberrant expression (at least 2-fold change), P<0.05. In the clustering analysis, red and green regions indicate the up-regulated and down-regulated genes, respectively. (c) An enrichment analysis of the top 10 pathways for DEGs based on the KEGG database. The horizontal and vertical axes represent the enrichment score of –logP and the pathway category, respectively. (d) The network represents the correlations between TP53-related genes. Large and small node sizes represent high and low relevance, respectively. Lines were defined as the interaction of the genes

