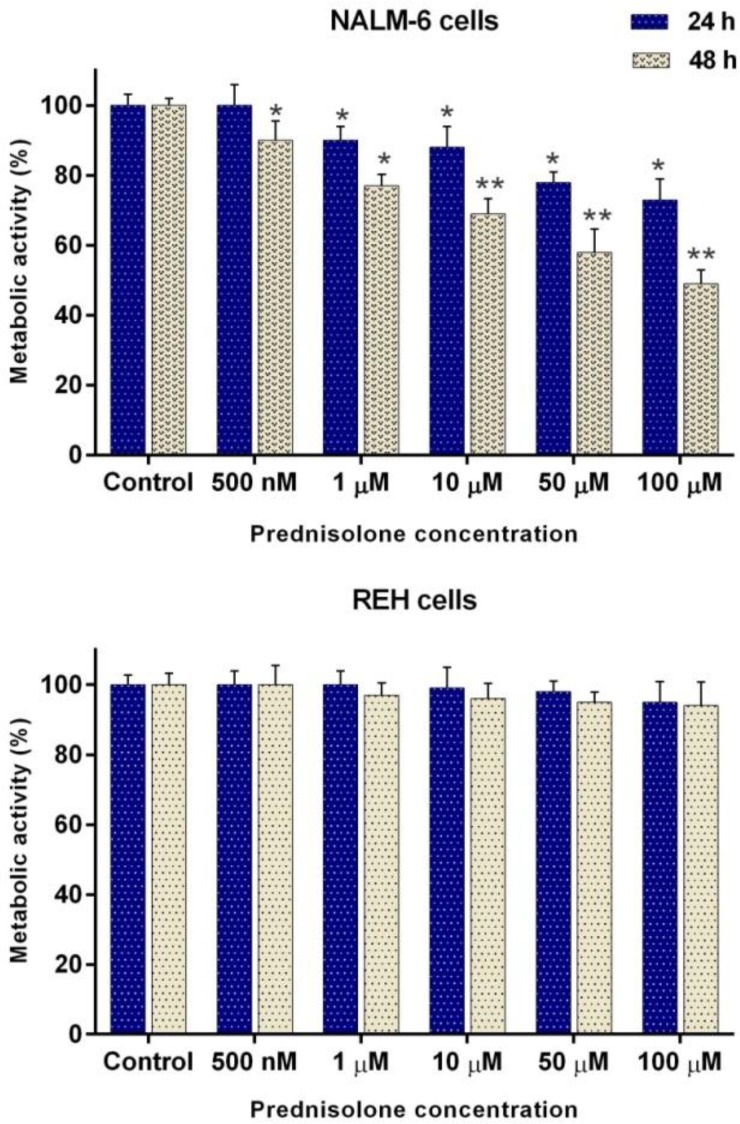
Figure 6.
Cytotoxic effect of Prednisolone on NALM-6 and REH cell lines. The cells were treated with different concentration of Prednisolone and their metabolic activities were measured after 24 and 48 h incubation, using the MTT assay. Values are given as mean ±SD of three independent experiments. *P < 0.05 and **P < 0.01 represent considerable alterations from untreated control.

