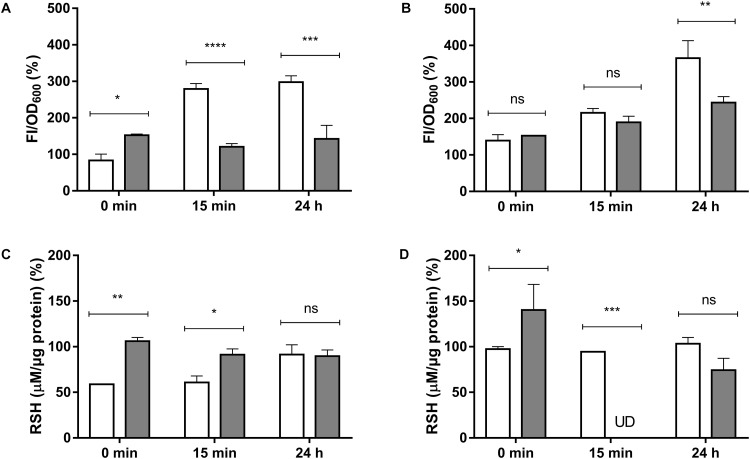
FIGURE 2.
Total ROS (A,B) and intracellular RSH (C,D) concentration in E. cloacae MF01 exposed to HAuCl4 or K2TeO3. Cells were treated for the indicated times with HAuCl4 (A–C) or K2TeO3 (B,D), in aerobic (white bars) or anaerobic conditions (gray bars). While HAuCl4 exposure concentrations were 0.25 mM (aerobic) and 0.125 mM (anaerobic), those of K2TeO3 were 0.008 and 0.016 mM, respectively. Fluorescence intensity and RSH concentrations were expressed as per cent of those values observed in the respective control conditions (100%). The data represent the average of three independent tests ± SD. ∗p < 0.0216; ∗∗p < 0.0012; ∗∗∗p < 0.0002; ∗∗∗∗p < 0.0001; ns, not significant; UD, undetectable.

