FIGURE 2.
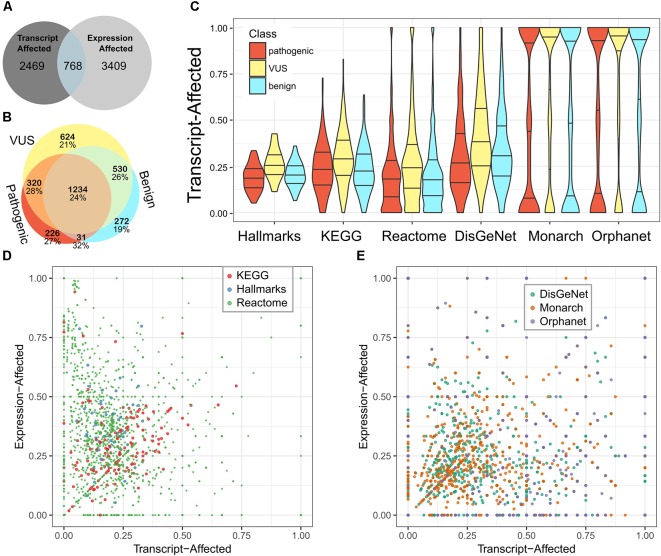
Most pathways and diseases are affected by variability in transcript selection and tissue-specific expression. We identified genes affected by each feature and calculated the fraction of genes affected within pathways or defining diseases. (A) We compare the number of genes defined as transcript-affected and expression-affected. (B) Among transcript-affected genes, we distinguish among the classification of variants. Most transcript-affected genes are affected by pathogenic or VUS. The percent of each genes that are also expression-affected is shown below the count, for each category of gene. (C) Across three resources that define biologic pathways (Hallmarks, KEGG, and Reactome) and three resources that define diseases (DisGeNet, Monarch, and Orphanet), the fraction of expression-affected genes varied significantly, but averaged to about 25%. We show the distribution of pathways’ fraction of genes affected using a violin plot (smoothed histogram) with quartiles indicated by horizontal lines; the middle line is the median. Genes affected by each of three classes of variants are distinguished. (D) For the three resources of biologic pathways, we show the more nuanced relationship between expression-affected and transcript-affected; each point in the plot is a pathway. Because there are many more Reactome pathways than the other two resources, points representing Reactome pathways are smaller so that they do not fully occlude others. (E) We similarly summarized diseases. There are multiple diseases for which every contributing gene is expression- or transcript-affected.

