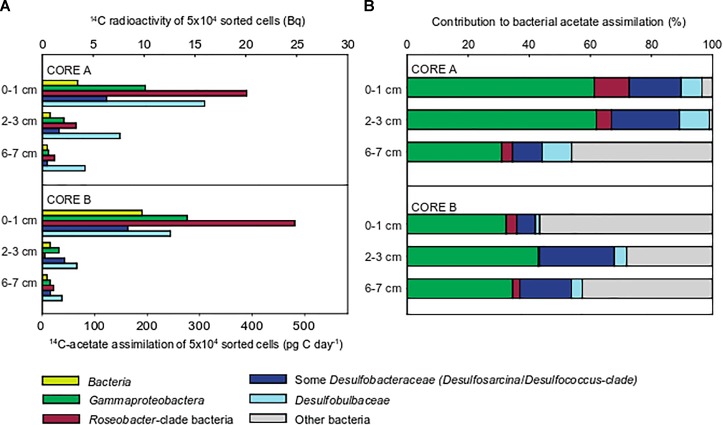
FIGURE 2.
Acetate assimilation rates and 14C-carbon activity in 50,000 cells flow-sorted after CARD-FISH from incubations of whole sediment cores (June 2009). The following populations were flow-sorted according to their CARD-FISH signal: Bacteria (probe EUBI-III), Gammaproteobacteria (probe GAM42a), Roseobacter-clade bacteria (RCB, probe ROS537), Desulfobulbaceae (probe DSB706), and members of the Desulfobacteraceae (probe DSS658). Batches of 50,000 cells were sorted for quantification (A). Integration of relative cell abundances of flow-sorted populations and their 14C-acetate assimilation rates shows the relative contribution to total bacterial 14C-acetate assimilation (B).

