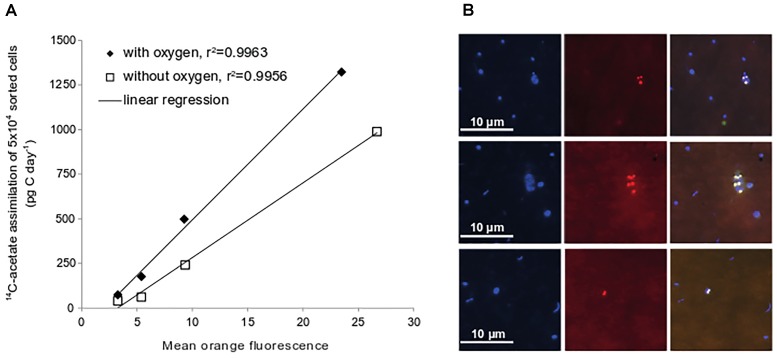
FIGURE 4.
Acetate assimilation rates of flow-sorted cells after Nile Red-staining. Four different mean fluorescence intensity classes were defined for flow-sorting (see Supplementary Figure S2). Values are depicted as average of duplicate sediment slurries incubated under oxic or anoxic conditions (October 2009) (A). Epifluorescence images of samples from sediment slurry incubations stained with DAPI and Nile Red. DAPI-stained cells, left panel; Nile Red-stain, middle panel; overlay of images right panel (B).

