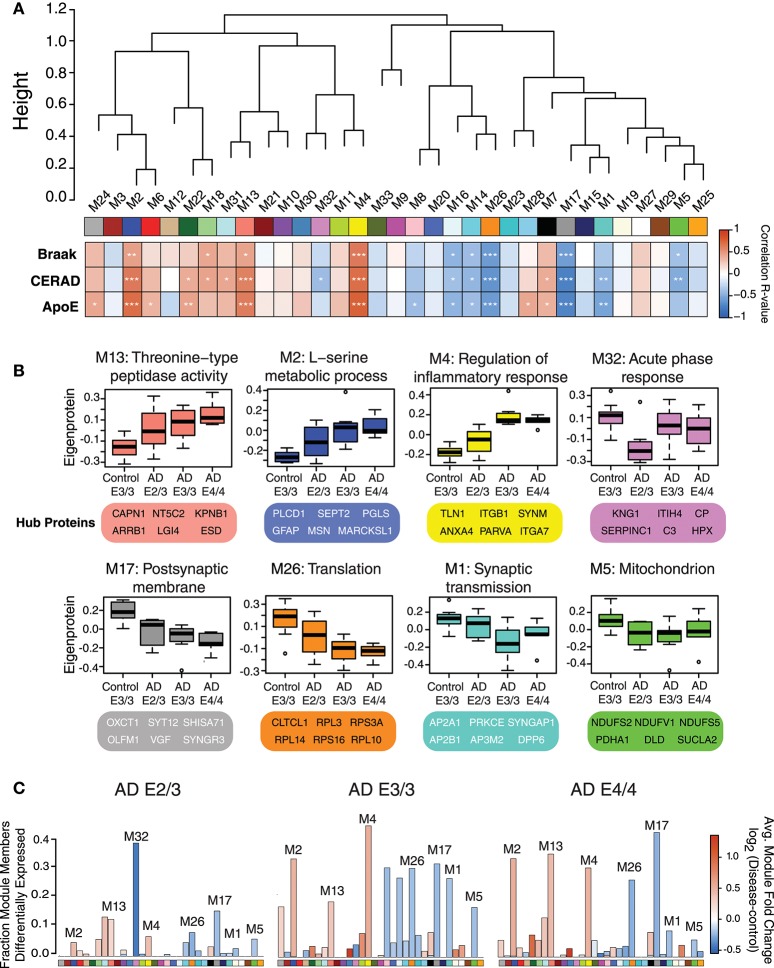
Figure 2.
Protein Coexpression Network and Differential Abundance by APOE Genotype in AD. (A–C) Weighted Protein Correlational Network Analysis (WPCNA) was performed on 32 control and AD cases, and the resulting module eigenproteins were correlated to tau tangle burden (Braak stage), neuritic amyloid plaque burden (CERAD score), and APOE genotype using an ordinal scale where an E2 allele = −1, E3 = 0, and E4 = 1 (see main text) (A). Strength of correlation to each trait is shown by heatmap, where red indicates positive correlation, and blue indicates negative correlation. Module-trait correlations were performed using biweight midcorrelation (bicor). *p < 0.05, **p < 0.01, ***p < 0.001. (B) Selected modules that showed significant trait correlations were analyzed by gene ontology (GO) analysis, with the resulting top GO term for each module listed as the module description. The most highly correlated proteins within each module (“hub proteins”) are listed below each module. Module eigenprotein values are plotted in control and AD APOE genotypes. (C) Differential protein abundance for each AD case group compared to control E3/3, by module. The height of the bars represents the fraction of module member proteins that had a difference in abundance compared to control. The bars are color coded by heatmap for average log2 difference in abundance, where red represents an increase in abundance in AD, and blue represents a decrease in abundance in AD.

