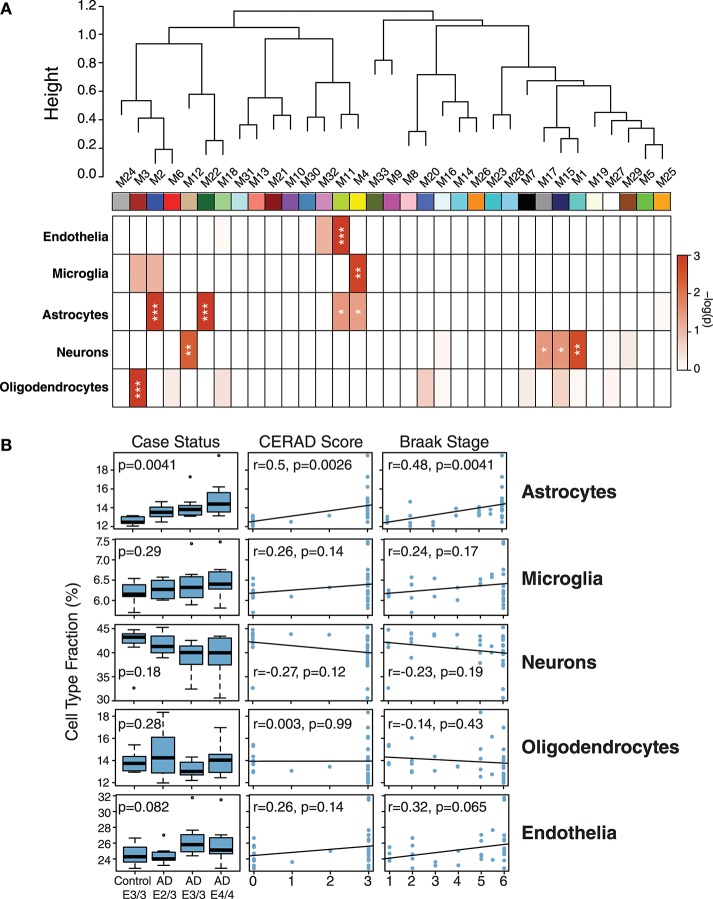
Figure 3.
Network Module Cell Type Enrichment and Effect of APOE Genotype on Cell Type Changes in AD. (A,B) Cell type protein markers for microglia, astrocytes, neurons, and oligodendrocytes (Sharma et al., 2015)—and mRNA markers from endothelial cells (Zhang et al., 2014b)—from purified brain cell types were used to assess cell type enrichment for each network module by Fisher's exact test (A). Significance of enrichment for a given cell type is shown by one-color heat map, with p values provided for selected cell type overlaps in Supplementary Table 3. P values were corrected by the Benjamini-Hochberg false discovery rate method. *p < 0.05, **p < 0.01, ***p < 0.001. (B) Cell type fraction estimation in control and AD cases by APOE genotype, and correlation of cell type fraction with amyloid plaque burden (CERAD score) and tau neurofibrillary tangle burden (Braak stage). Differences in cell type fraction among control and AD cases were assessed after one-way ANOVA. Correlations were performed using biweight midcorrelation (bicor).

