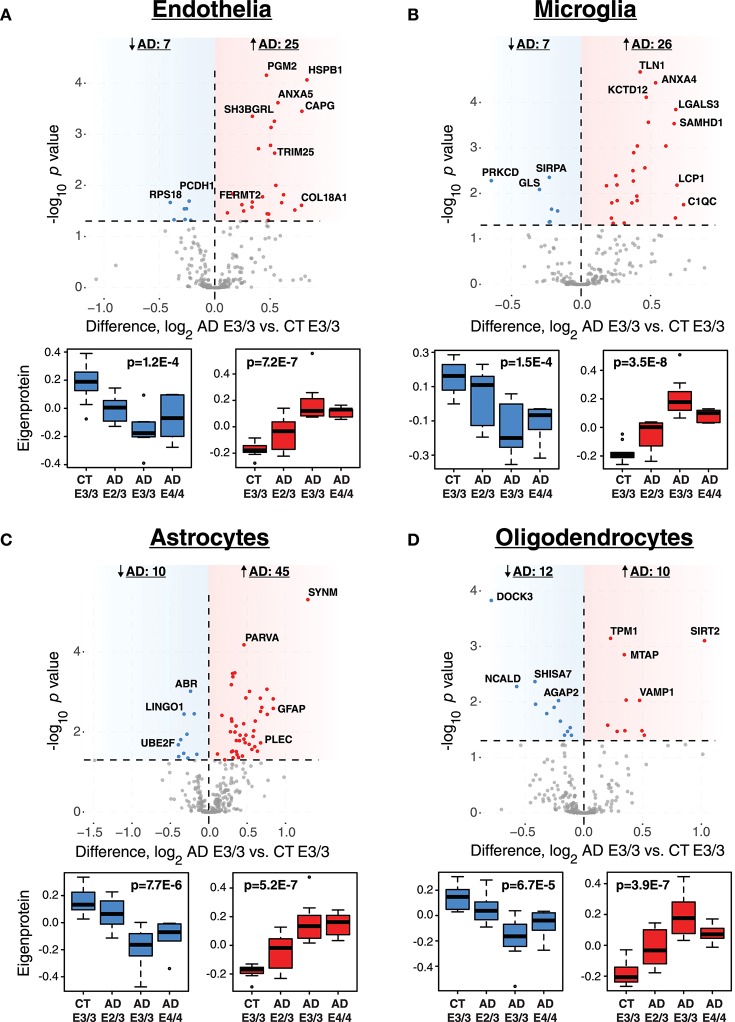
Figure 4.
Differential Expression of Cell Type Markers in AD and Effects of APOE Genotype on Marker Expression. (A–D) Cell type markers for endothelia (A), microglia (B), astrocytes (C), and oligodendrocytes (D) were analyzed for significant changes between control and AD on the ApoE 3/3 background. For those markers that were significantly increased (red) or decreased (blue) in AD E3/3 compared to control E3/3 brains (p < 0.05), a synthetic eigenprotein was generated for the significantly increased or decreased protein groups and analyzed for changes across APOE genotype by one-way ANOVA with Tukey's test. P values for one-way ANOVA are given in the box plots. Differences between AD E2/3 and control E3/3 were insignificant, while differences between AD E2/3 and AD E3/3 were significant, for decreased (or “homeostatic”) cell type marker eigenproteins for all cell types except endothelia (not significant for either comparison). Differences between AD E2/3 and AD E3/3 were significant for all increased (or “disease-associated”) cell type marker eigenproteins, while differences between AD E2/3 and control E3/3 were insignificant only for astrocytes (p = 0.06) and endothelia (p = 0.11). For a list of all p values after Tukey's test and a description of all markers, see Supplementary Data. CT, control; AD, Alzheimer's disease.

