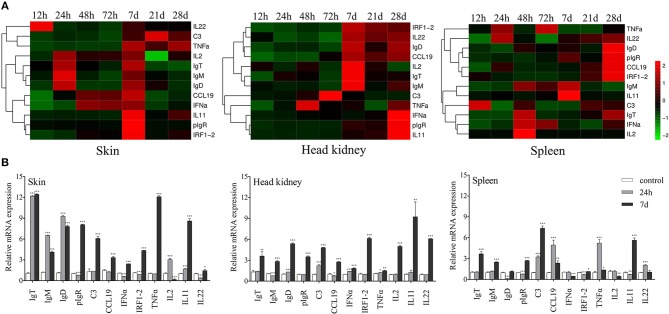
Figure 2.
Kinetics of immune responses in skin of trout following Ich parasites infection. (A) Pheatmap package of R (version 3.4.4) was used to picture heat maps to illustrate the kinetics of immune responses in trout skin (left), head kidney (middle), and spleen (right) of Ich-challenged vs. control group measured at 12, 24, 48, 72 h, 7, 21, and 28 d after infections with Ich parasites (n = 6 fish per group). Pearson correlation was carried out and ‘Complete’ method was used to cluster values. (B) Fold changes of immune genes and makers in different tissues at 24 h and 7 d were shown with histogram. *P < 0.05, **P < 0.01, ***P < 0.001 (unpaired Student's t-test). Data are representative of three different independent experiments (mean ± s.e.m.).

