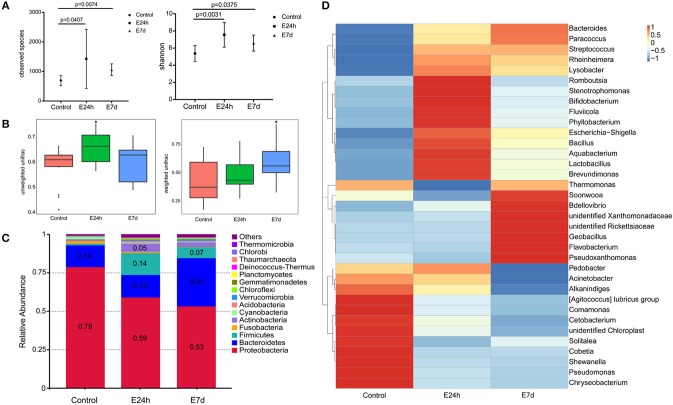
Figure 5.
Changes in the abundance and diversity of trout skin microbiota community in response to Ich parasites infection. (A) Microbial alpha diversity was destabilized post Ich infection. Calculating of observed species and Shannon index from different groups indicated significantly increased alpha diversity at 24 h and 7 d post infection. (B) The microbial beta diversity was analyzed using unweighted Unifrac and weighted Unifrac also exhibited destabilization after Ich infection. (C) Bacterial community composition of trout skin in each group was extremely changed after parasite stimulation. Bar chart of the mean relative abundance in phyla was presented to describe the details. Numbers that had abundances >0.05 (5%) were just noted to represent the relative percentage of each phyla. (D) Heat map showing the relative abundance reveals striking microbial dynamics and compositional differences between control and infected groups based on top 35 OTUs in the skin. Columns are arranged by similarity using hierarchical clustering. The relative abundance data was log 10 transformation. E24h, 24 h after Ich infection; E7d, 7 days after Ich infection. *P < 0.05 (unpaired Student's t-test) in figure B.

