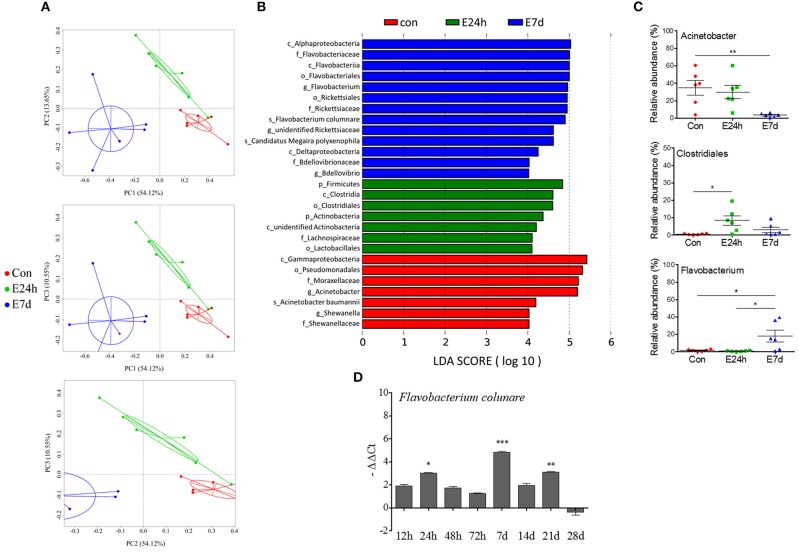
Figure 6.
The longitudinal variation of microbial composition and biomarkers following Ich-parasites invasion. (A) Principal coordinate analysis (PCoA) with weighted UniFrac distance matrix for all the 18 taxonomic profiles from trout skin following parasite infection. Each dot represents one sample. Red pots indicate control samples, green for E24h and blue for E7d, respectively. (B) Description of biomarkers that were significant different between control and infection groups. (C) Ich infection results in losses of beneficial bacteria and increased abundance of opportunistic pathogens in trout skin. Percentage of total OUTs represented by Acinetobacter, Clostridiales, and Flavobacterium in control and infected groups were shown. (D) Relative abundance of Flavobacterium columnare shown as –ΔΔCt was increased according with Ich infection in experimental groups. Con, control group; E24h, 24 h after Ich infection; E7d, 7 days after Ich infection. *P < 0.05, **P < 0.01, ***P < 0.001 (unpaired Student's t-test). The qRT-PCR data in (D) were representative of three different independent experiments (mean ± s.e.m.).

