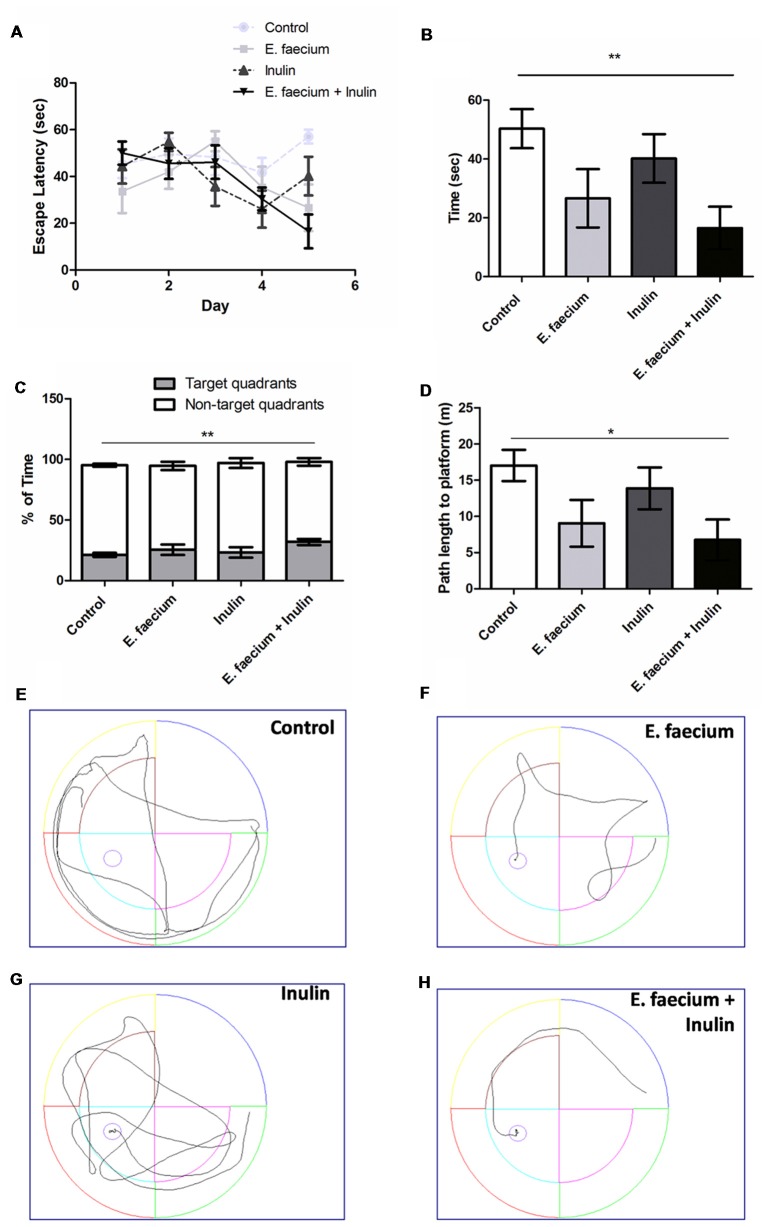
Figure 1.
Results from the Morris Water Maze (MWM) test. (A) Escape latency time (seconds) from starting point in the North quadrant and platform in Southwest (SW) quadrant shows a decrease in time in all the supplemented groups. Two-way ANOVA for repeated measures followed by post hoc Bonferroni, F(12,116) = 1.96; p = 0.03; (B) In day 5 of the acquisition phase, symbiotic group shows a significantly lower escape time vs. control group. Mean ± SEM, n = 8, Mann-Whitney U **p < 0.01; (C) Time spent (percentage) in the target quadrant compared to the non-target quadrants. Mean ± SEM, n = 8. Mann-Whitney U test; **p < 0.01; (D) Path length to platform (m) measured during the last day (5th) of the acquisition test. Mean ± SEM, n = 8, Mann-Whitney U; *p < 0.05; (E–H) Illustrative images of rats trajectories in MWM during last days’ trials of study groups: control (E), probiotic (E. faecium; F), prebiotic (agave inulin; G) and symbiotic (E. faecium + agave inulin; H). This experiment is one of two in which the same effect was observed.

