Figure 6.

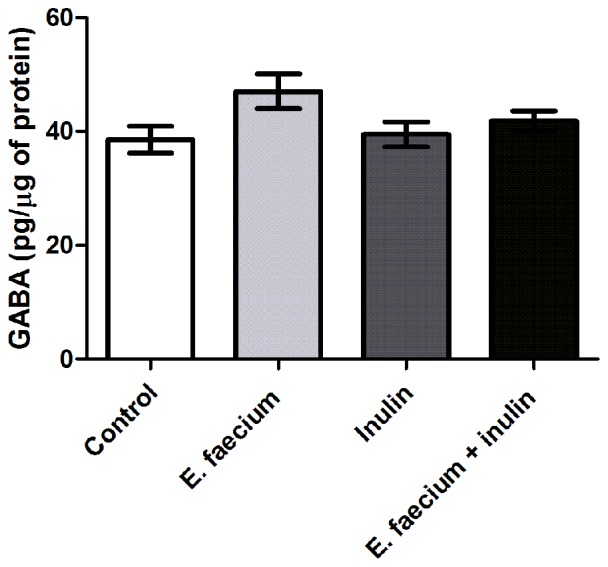
Results from hippocampal γ-aminobutyric acid (GABA) concentrations of middle-aged rats. GABA concentrations show no difference between groups. Mean ± SEM, n = 8 for each group, Kruskal-Wallis.

Results from hippocampal γ-aminobutyric acid (GABA) concentrations of middle-aged rats. GABA concentrations show no difference between groups. Mean ± SEM, n = 8 for each group, Kruskal-Wallis.