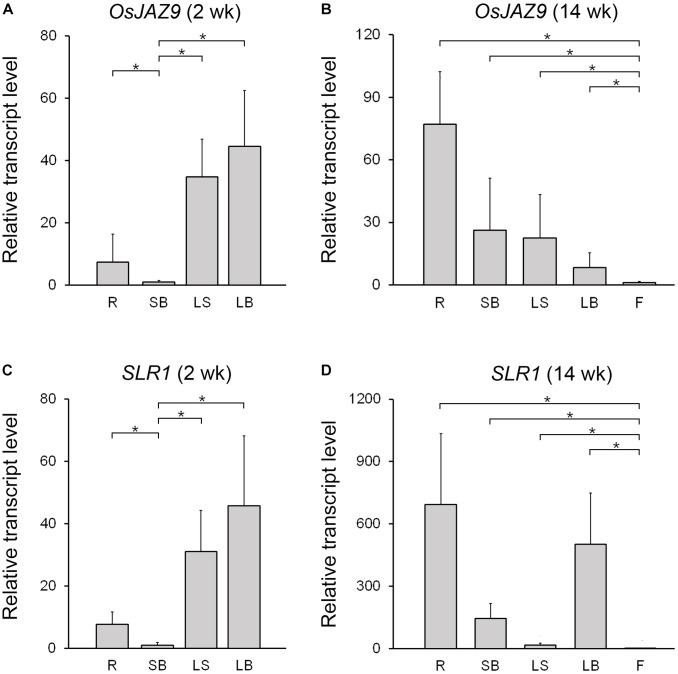
FIGURE 3.
Expression patterns of OsJAZ9 and SLR1 in rice. (A,B) Expression of OsJAZ9 in 2- (A) and 14-week-old rice (B). (C,D) Expression patterns of SLR1 in 2- (C) and 14-week-old rice (D). Tissues tested were: root (R), shoot base (SB), leaf sheath (LS), leaf blade (LB), and flower (F). Total RNAs were extracted from the indicated samples, and the expression level was analyzed by RT-qPCR. Data represent mean values of three biological replicates, and error bars indicate SD. Asterisks show statistically significant differences between the indicated samples (p-value < 0.01, Student’s t-test). OsTubA2 (Os11g0247300) was used as an internal control and relative expression levels are shown as fold values.

