FIGURE 6.
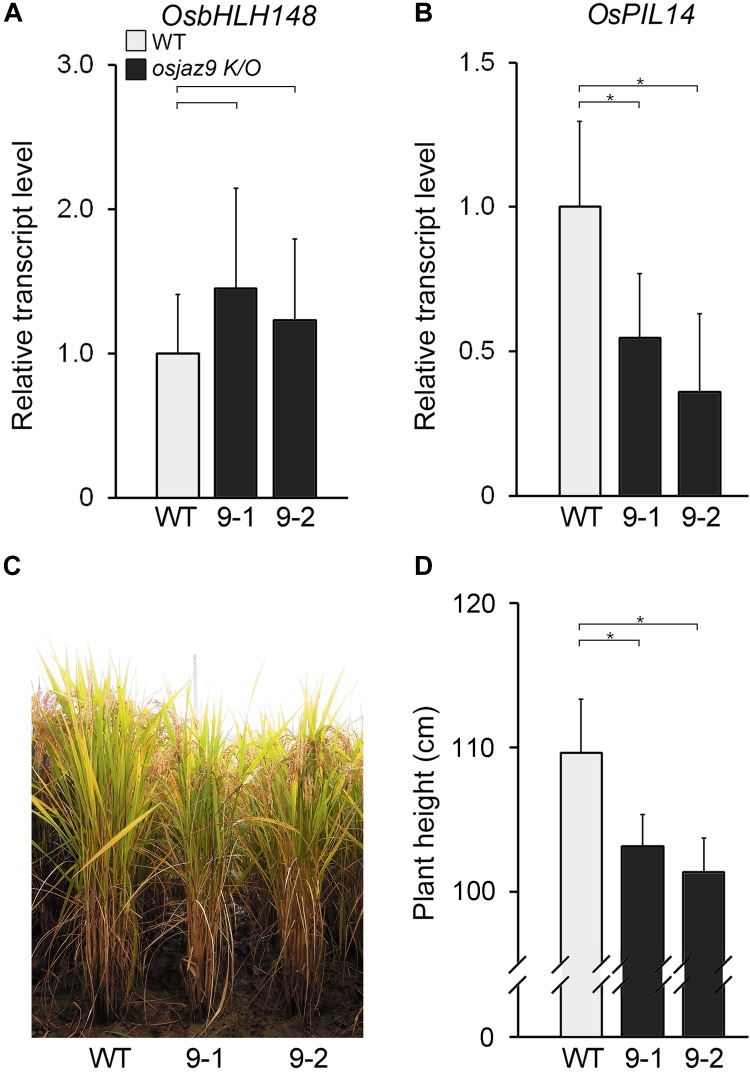
The reduced GA response in the osjaz9 mutants. (A,B) RT-qPCR analysis showing the expression levels of OsbHLH148 (A) and OsPIL14 (B) in the leaf blades of 8-week-old osjaz9 mutant plants. 9-1 and 9-2 indicate two independent mutants, osjaz9-1, and osjaz9-2. Data represent mean values of three biological replicates, and error bars indicate SD. OsTubA2 was used as an internal control and relative expression levels are shown as fold values. (C,D) Images of osjaz9 plants grown in field conditions for 25 weeks (C), and quantification of plant height (D) (n > 30). Error bars indicate SD. Asterisks indicate statistically significant differences between the corresponding samples and their control (p-value < 0.01, Student’s t-test).

