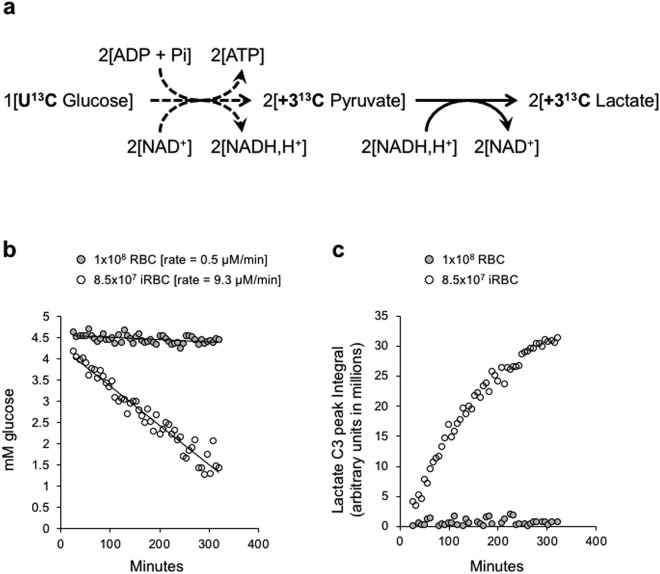
Figure 1.
Real time measurement of glycolytic activity from live RBC and iRBC by 13C NMR. (a) Schematic representation of stoichiometric conversion of U13C-glucose to U13C-lactate. U13C-glucose utilization (b) and U13C-lactate production (c) by RBCs (grey filled circles) and iRBCs (open circles), respectively, were measured. In case of glucose absolute quantification in mM concentration was determined using glucose standard (Supplementary Fig. S1d), while for lactate, the raw integral value for the carbon 3 (C3) peak was plotted for each time point. The rate at which glucose is metabolized by RBCs and iRBCs is derived from the slope of the linear portion of the respective fits. Data shown in b and c were obtained from the same experiment.

