Figure 2.
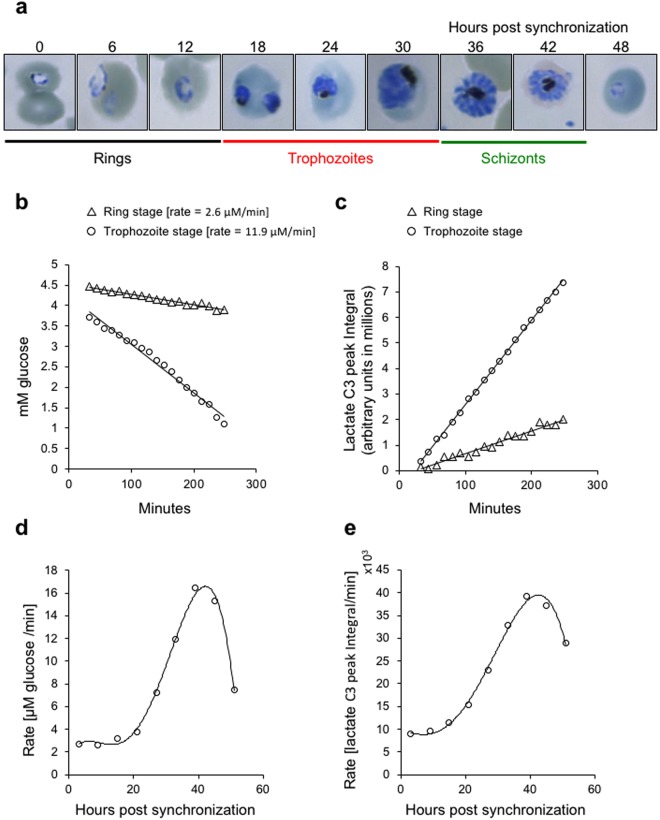
Temporal profiling of glycolytic activity during the 48 h intraerythrocytic development of P. falciparum. (a) Giemsa stained smears showing the different developmental stages of P. falciparum at 6 h intervals following sorbitol synchronization of the parasites. U13C-glucose metabolism (b) and U13C-lactate production (c) by ring stage (culture sampled from 0.5 hps to 6 hps) and late trophozoite stage (culture sampled from 30 hps to 36 hps) parasites respectively. Data was plotted as in Fig. 1. Glycolytic profile of iRBCs during the complete 48 h intraerythrocytic developmental cycle is plotted as either the rate of glucose depletion (d) or rate of lactate formation (e), respectively.

