Figure 3.
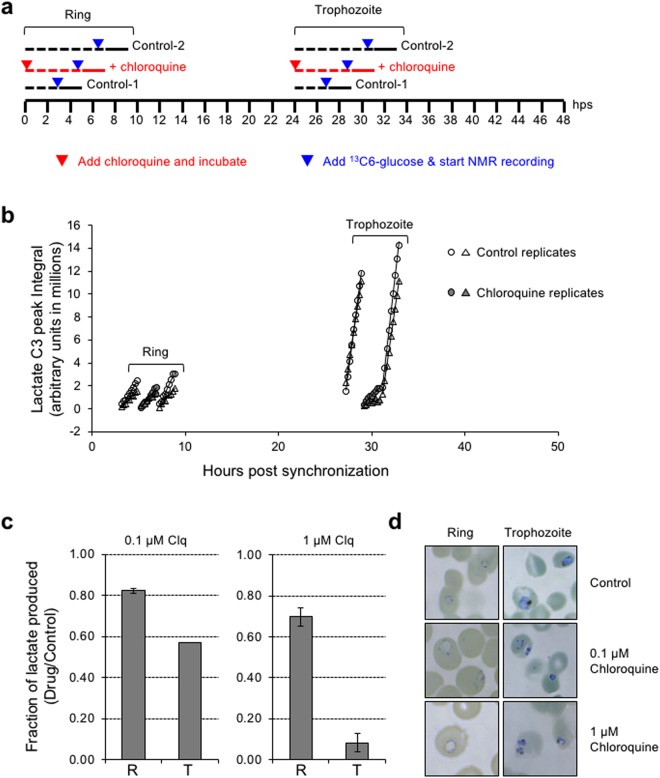
Evaluating the effect of chloroquine on glycolytic activity of ring and trophozoite stage P. falciparum. (a) Schematic representation of the experimental set-up. The scale represents the 48 h period following sorbitol synchronization of the iRBCs. The three lines shown above this scale indicate control (black) and drug (red) treated samples. In each line, the dashed part indicates the incubation time before addition of U13C-glucose (blue inverted triangles) and the bold part indicates the 2 h period during which the NMR measurements were taken. The red inverted triangles indicate the time at which the drug was added. Parasites were treated with drug for a total of 7 h (5 h before and 2 h during NMR measurements). hps, hours post synchronization. (b) Plot of the lactate C3 peak integral values for ring and trophozoite stage parasites measured for 2 h by NMR. Data from two replicate experiments are overlaid; individual replicate data is provided in Supplementary Fig. S4. (c) The plots depict the fold-change in glycolytic rate in ring (R) and trophozoite (T) stage parasites, in the presence of 0.1 µM and 1 µM chloroquine, respectively. All the experiments were performed in duplicates and the error bars represent standard deviation for drug vs control. (d) Giemsa stained smears of cultures recovered after NMR measurement showing the morphology of iRBCs from control and chloroquine (0.1 µM and 1 µM) treated ring and trophozoite stage parasites, respectively.

