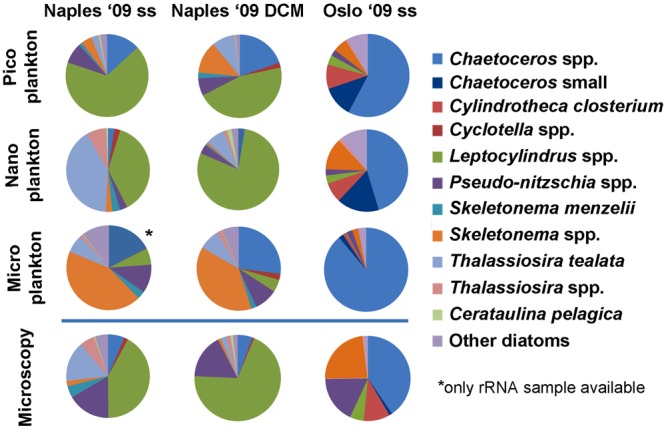
Figure 3.

Species distribution in the three size-fractions and from light microscopy (non-fractionated) samples from Naples subsurface (ss) and DCM waters (October 2009) and Oslo subsurface waters (September 2009). rDNA and rRNA results were merged. Data from Oslo ’09 are from Dittami et al.58. The main taxa detected through metabarcoding matched those seen by light microscopy of the corresponding samples. The relative abundance of taxa from cell counts was generally more similar to that detected by sequences in the nanoplanktonic size fraction.
