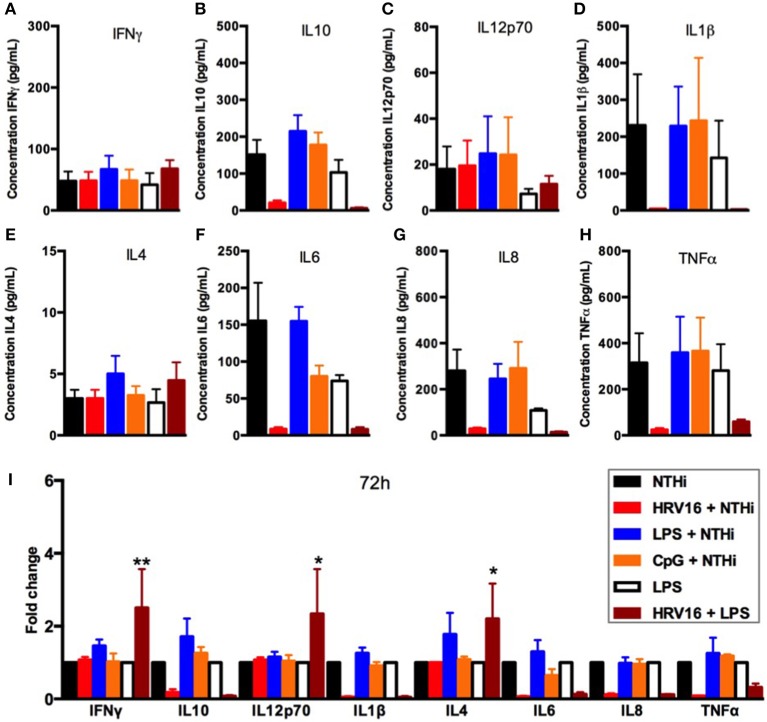
Figure 6.
Cytokine response of human macrophages exposed to HRV16 or TLR agonists for 72 h and then challenged with NTHi or LPS. Human macrophages were exposed to HRV16 (red bars), LPS (blue bars), CpG (orange bars) or MI (black bars) for 1 h and rested for 72 h. Then they were exposed to NTHi or LPS for 2 h and supernatants were collected and analyzed by MSD. MSD results for (A) IFNγ, (B) IL10, (C) IL12p70, (D) IL1β, (E) IL4, (F) IL6, (G) IL8, (H) TNFα. (I) Relative fold changes for cytokine production in HRV16, LPS or CpG exposed human macrophages. *p < 0.05, **p < 0.01 Two Way Anova with Dunnett's Post Test vs. NTHi or MI + LPS. Error bars represent standard error of the mean (SEM). n = 4 independent experiments on different donors.

