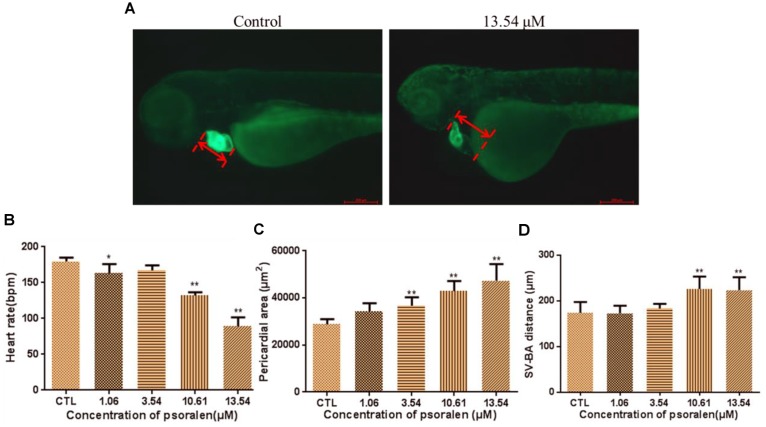
FIGURE 3.
Effects of psoralen on developing heart. (A) Phenotypes of larvae of Tg(cmlc2:EGFP) lines. SV–BA distance is indicated by red row. (B) Heart rates at 72 hpf. (C) Pericardial area at 72 hpf. (D) SV–BA distance at 72 hpf. The values are expressed as mean ± SD (n = 3). ∗Represents p-value less than 0.05 and ∗∗represents p-value less than 0.01.

