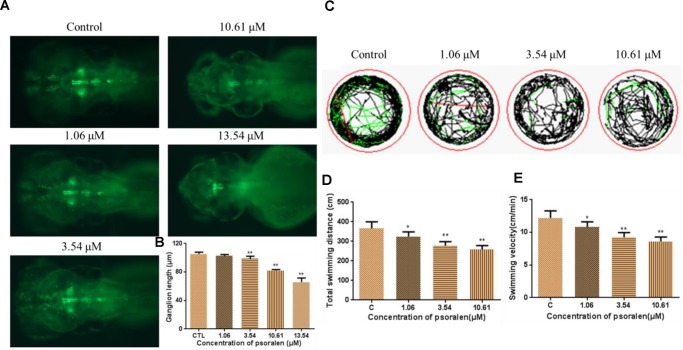
FIGURE 6.
Effects of psoralen on the developing nervous system. (A) Dopamine ganglion at 96 hpf. (B) The length of dopamine ganglion. (C) Motion track of larva at 7 dpf, red lines indicate high speed, green lines indicate middle speed, black lines indicate slow speed. (D) Total swimming distance. (E) Swimming velocity. The values are expressed as mean ± SD (n = 3). ∗Represents p-value less than 0.05 and ∗∗represents p-value less than 0.01.

