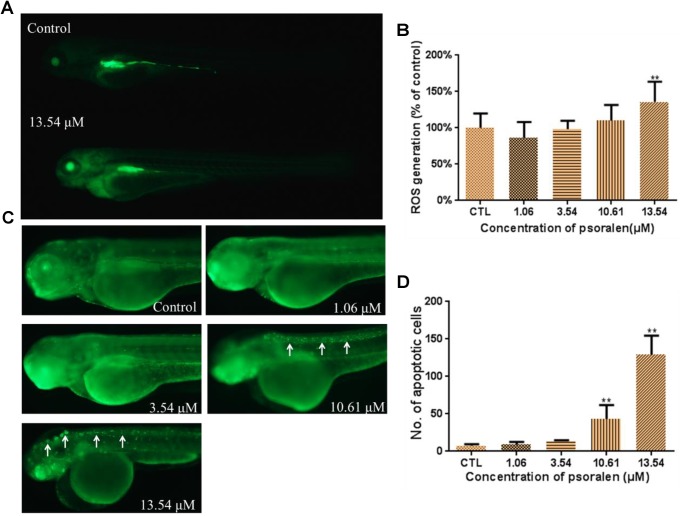
FIGURE 7.
Effects of psoralen on the ROS generation and apoptosis. (A) Fluorescence micrographs of ROS generation in zebrafish larvae at 96 hpf. (B) Quantitative analysis of ROS generation. (C) Fluorescence micrographs of apoptotic cells in zebrafish larvae at 96 hpf (White arrows indicate apoptotic cells in nervous system). (D) Quantitative analysis of apoptotic cells. The values are expressed as mean ± SD (n = 3). ∗Represents p-value less than 0.05 and ∗∗ represents p-value less than 0.01.

