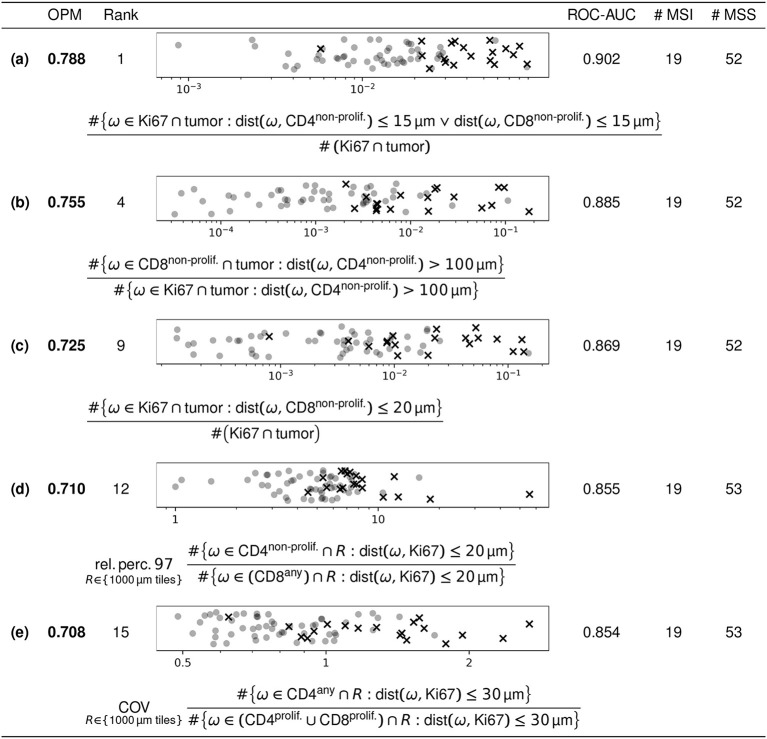
Figure 5.
Selected features with high discriminatory power. Of the 108,579 features included in our analysis, the figure shows five selected features of high discriminatory power. The parameters for the features shown are explained in the text. The scatter plots show the feature values of the respective feature (all of which are dimensionless), with MSI and MSS as crosses and circles, respectively. Data points are uniformly randomly scattered in vertical direction and plotted on a logarithmic horizontal scale.

