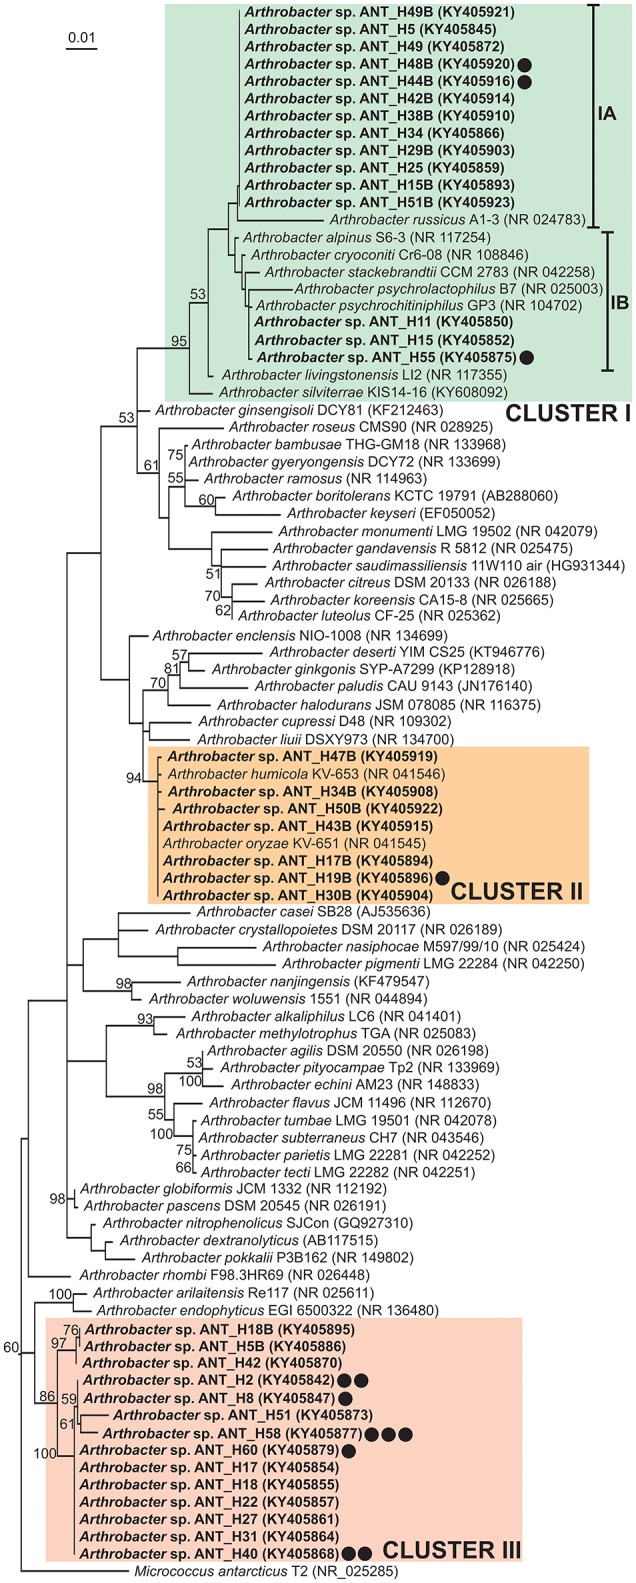
Figure 1.

Phylogenetic tree for 16S rDNA sequences of Arthrobacter spp. The tree was constructed by applying the Maximum Likelihood method based on the Tamura-Nei model. Statistical support for the internal nodes was determined by 1,000 bootstrap replicates and values of ≥50% are shown. The tree is drawn to scale, with branch lengths measured in the number of substitutions per site. The analysis involved 91 nucleotide sequences. All positions containing gaps and missing data were eliminated. There were a total of 1,121 positions in the final dataset. The 16S rDNA sequence of Micrococcus antarcticus T2 was used as an outgroup. GenBank accession numbers of the 16S rDNA sequences used for the phylogenetic analysis are given in brackets. The strains analyzed in this study are in bold text. Clusters I–III, distinguished by colored backgrounds, contain the ANT strains. The IA and IB subclusters are within the cluster I. Strains containing plasmids were indicated by black dots. Number of dots corresponds to the number of plasmids found within the particular strain.
