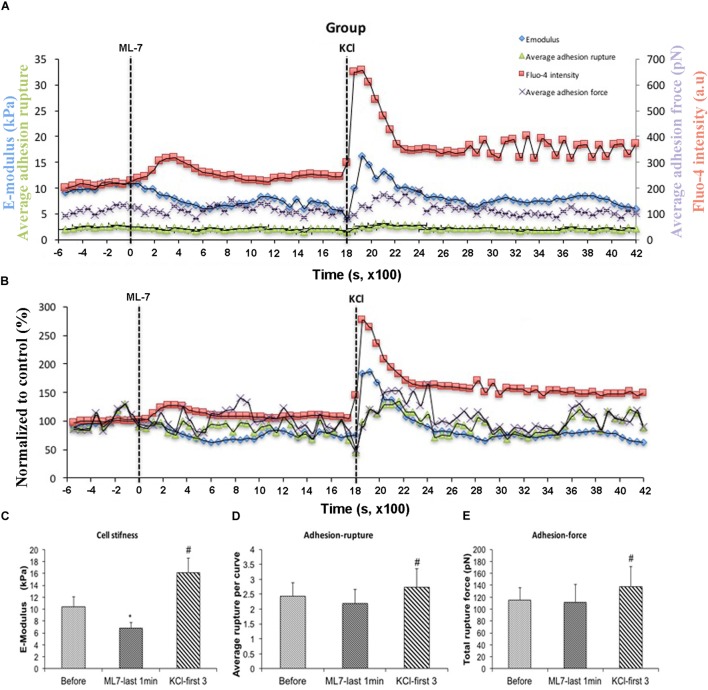
FIGURE 5.
With pre-treatment of ML-7, KCl elevated cell stiffness, cell adhesion to FN as well as the level of [Ca2+]i. All cells responded to KCl treatment. (A) Group average real-time recordings of [Ca2+]i (red), cell stiffness (blue), rupture events (green), and rupture force (purple) before and after addition of ML-7 and KCl (n = 10). (B) Group recordings of [Ca2+]i (red), cell stiffness (blue), rupture events (green), and rupture force (purple) normalized to average summed all time points without treatment (n = 10). (C) Average elastic modulus summed across all time points for the group of VSMCs before treatment, time points of 15 min of ML-7 (15 μM) and first three time points after addition of KCl (60 μM) (n = 10, ∗p < 0.05 compared to no-treatment, #p < 0.05 compared to ML-7). (D) Average rupture numbers per curve summed across all time points for the group of VSMCs before treatment, time points of 15 min of ML-7 (15 μM) and first three time points of after addition of KCl (60 μM) (n = 10, ∗p < 0.05 compared to no-treatment, #p < 0.05 compared to ML-7). (E) Average rupture force summed across all of time points for the group of VSMCs before treatment, following 15 min pre-incubation with ML-7 (15 μM) and first three time points of after addition of KCl (60 μM) (n = 10, ∗p < 0.05 compared to no-treatment, #p < 0.05 compared to ML-7). Data were collected by FN-coated AFM at 0.1 Hz of indentation frequency and are presented as mean ± SEM.

