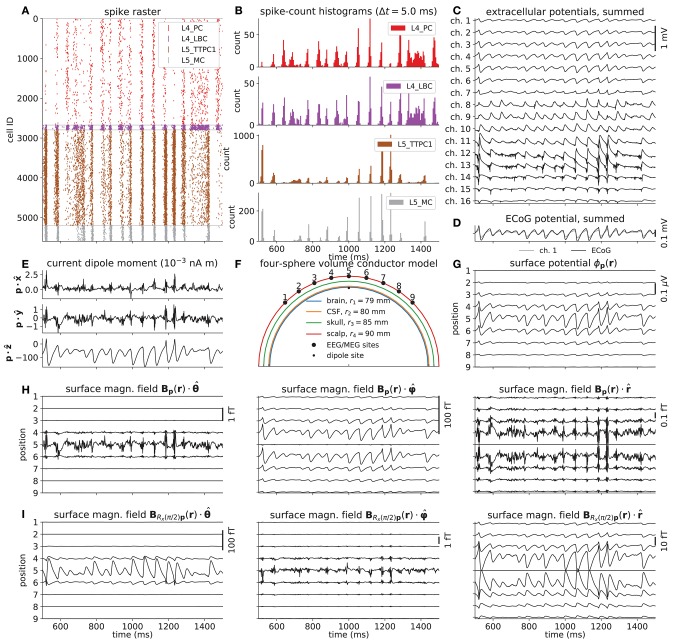
Figure 5.
Intra- and extracellular measures of activity in example network. (A) Spike raster plot for each population. Each row of dots corresponds to the spike train of one neuron, color coded by population. (B) Population spike rates computed by summing number of spike events in each population in temporal bins of width Δt = 5 ms. (C) Extracellular potentials as function of depth assuming an infinite volume conductor. (D) Extracellular potential on top of cortex (ECoG) assuming a discontinuous jump in conductivity between brain (σ = 0.3 S/m) and a non-conducting cover medium (σ = 0 S/m) and electrode surface radius r = 250 μm. The signal is compared to the channel 1 extracellular potential in (C) (gray line). (E) Component-wise contributions to the total current dipole moment p(t) summed over population contributions. (F) Illustration of upper half of the four-sphere head model (with conductivities σs ∈ {0.3, 1.5, 0.015, 0.3} S/m and radii rs ∈ {79, 80, 85, 90} mm for brain, csf, skull and scalp, respectively), dipole location in inner brain sphere and scalp measurement locations. The sites in the xz-plane numbered 1–9 mark the locations where electric potentials and magnetic fields are computed, each offset by an arc length of r4π/16 ≈ 18 mm. (G) EEG scalp potentials from multicompartment-neuron network activity with radially oriented populations. (H) Tangential and radial components of the head-surface magnetic field (MEG) from multicompartment-neuron network activity with radially oriented population. (I) Tangential and radial components of the magnetic field (MEG) on the head surface, with underlying dipole sources rotated by an angle θ = π/2 around the x-axis (thus with apical dendrites pointing into the plane). (Note that at position 5, the unit vectors and are defined to be directed in the positive y- and x-directions, respectively).

