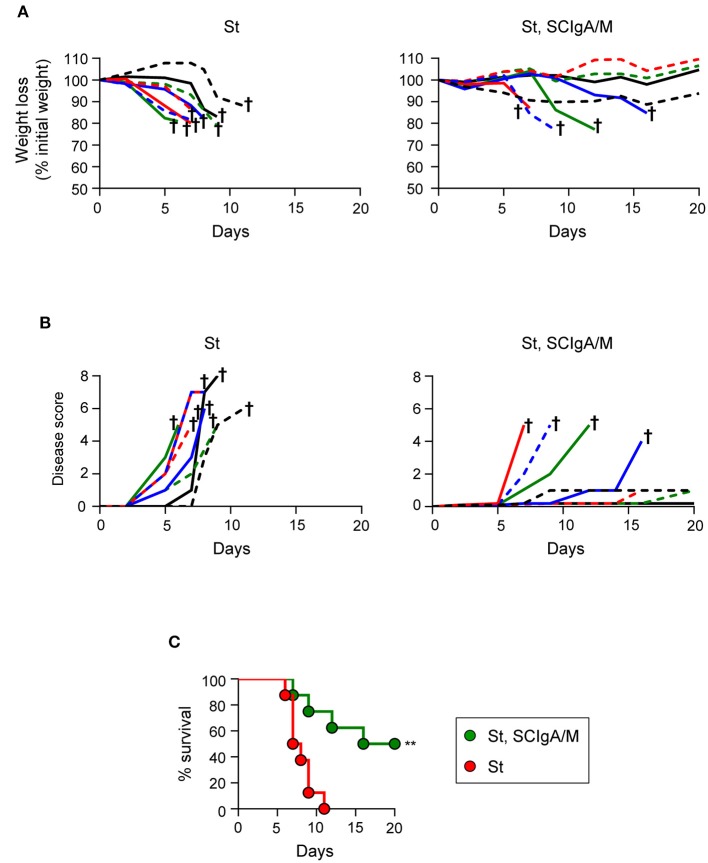
Figure 5.
Therapeutic administration of SCIgA/M preparation promotes mouse survival Time-dependent follow-up of mice infected with 2 × 10⁶ St prior to therapeutic treatment carried out 8 h post-infection with a single dose of the SCIgA/M preparation. Each depicted curve represents one individual mouse analyzed for weight loss (A) and disease scores (B). Sacrifice (depicted by a †) of mice having lost ≥20% of their initial weight was done to comply with the Veterinary Office's permit to conduct animal experiments. Each panel compiles the results of 2 independent experiments. (C) Survival curves resulting from the compilation of all mice in either the St alone group (red circles) or the therapeutically treated (St, SCIgA/M) group (green circles). **p < 0.01.

