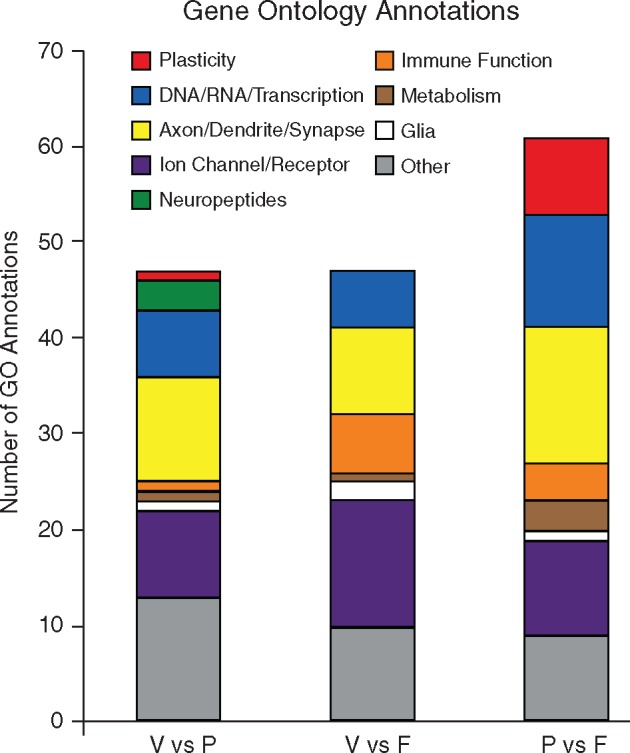
Figure 2.

enrichment of GO annotations across comparison groups. The gene enrichment analysis grouped the differentially expressed genes using GO annotations data. We selected significantly enriched GO annotations and identified the annotations that were involved in brain or behavioral processes. Those annotations were then categorized by function within each comparison group. We identified nine functional groups: plasticity (red), DNA/RNA/Transcription (blue), axon/dendrite/synapse (yellow), ion channel/receptor (purple), neuropeptides (green), immune function (orange), metabolism (brown), glia (white), and other (gray). We saw differences in the relative distribution of GO annotation functional groups across the comparison groups. Neuropeptides were only seen in the V vs P group, whereas the V vs F group showed a high number of annotations related to immune function. The P vs F group contained the largest number of annotations related to plasticity, DNA/RNA/transcription, and axon/dendrite/synapse
